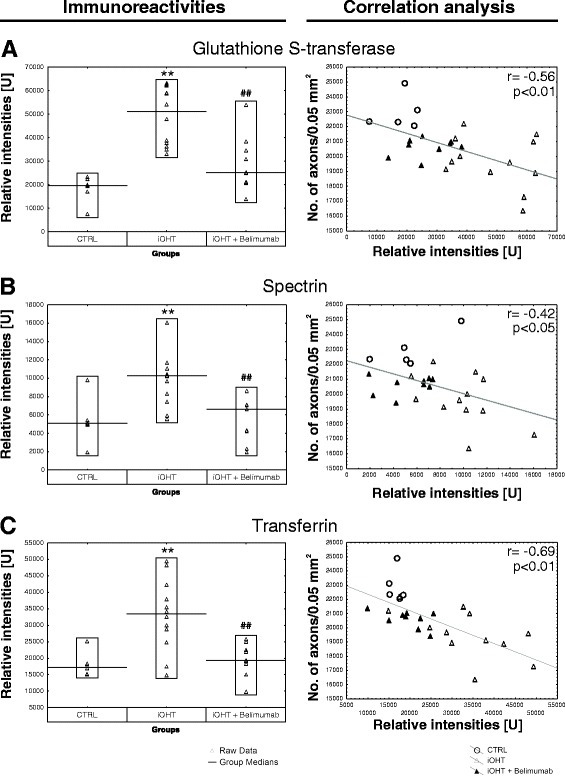
Fig. 6.

Systemic immune response. Quantification of different antigen reactivities of control animals (CTRL), animals that received unilateral intermittent ocular hypertension (iOHT), and animals with unilateral intermittent ocular hypertension which received Belimumab treatment (iOHT + Belimumab). The left side (a–c )shows the immunoreactivities in relative intensities [U] per group against glutathione S-transferase (a), spectrin (b), and transferrin (c). Each triangle represents one animal, and the black line indicates the group median. Compared with the relative intensity of CTRL, iOHT was significantly upregulated (**, p < 0.01) for all investigated antigens. Compared with iOHT, all immunoreactivities of iOHT + Belimumab were significantly downregulated (## p < 0.01). All p values were calculated by Tukey’s HSD post hoc test (unequal N). Scatterplots of the number of optic nerve axons in a distinct area (no. of axons/0.05 mm2) against relative intensities of glutathione S-transferase (a), spectrin (b), and transferrin (c) are shown on the right side. For correlation analysis, p values lower than 0.05 were considered as significant. The correlation coefficient r ranged between −0.42 and −0.69 for the investigated antibody reactivities (shown in upper right corner of the diagrams). The gray fitting line shows the negative linear dependence between the number of axons per 0.05 mm2 and the relative intensities. CTRLs are represented as empty circles, iOHT as empty triangle, and iOHT + Belimumab as filled triangle. Significant values are indicated as follows: **p < 0.01 compared with control group, ## p < 0.01 compared with iOHT group
