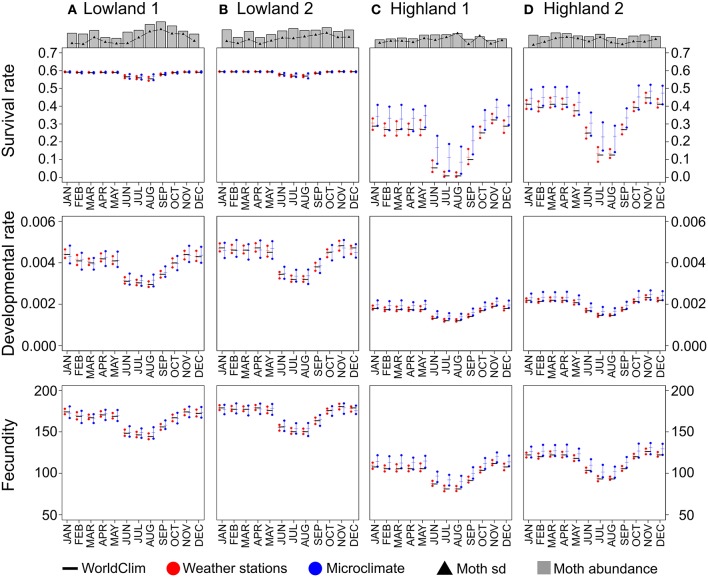
Figure 3.
Pest abundances and performances for each site based on the three temperature datasets. Pest abundances represent the mean sum of abundances for the three potato moth species. Black triangles display the standard deviations for each month. Performances were computed for each site using the mean values for the three potato moth species. WorldClim dataset based performances are represented as black horizontal bars. Weather stations and Microclimate datasets based performances are represented as red and blue points for the first and third quartiles, and as horizontal bars for the median. Panels (A–D) for the four study sites.

