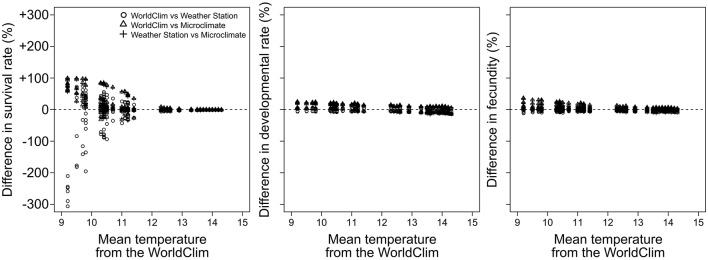
Figure 4.
Comparison between pest performances computed with the different temperature datasets as a function of the WorldClim temperature. For each performance, circles, triangles, and plus signs represent the difference between the WorldClim and the Weather stations, the WorldClim and the Microclimate, and the Weather stations and the Microclimate datasets, respectively.

