Figure 5.

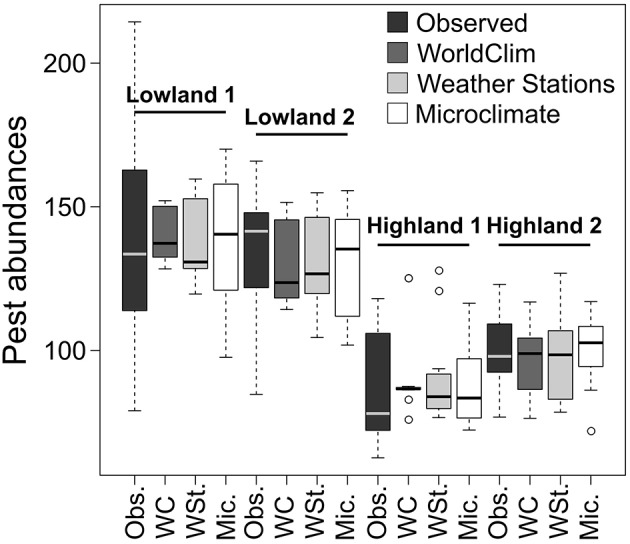
Observed and predicted abundances computed with the different temperature datasets for the four studied sites. Pest abundances are represented as boxplots and correspond to all pest abundances per month.

Observed and predicted abundances computed with the different temperature datasets for the four studied sites. Pest abundances are represented as boxplots and correspond to all pest abundances per month.