Fig. 4.

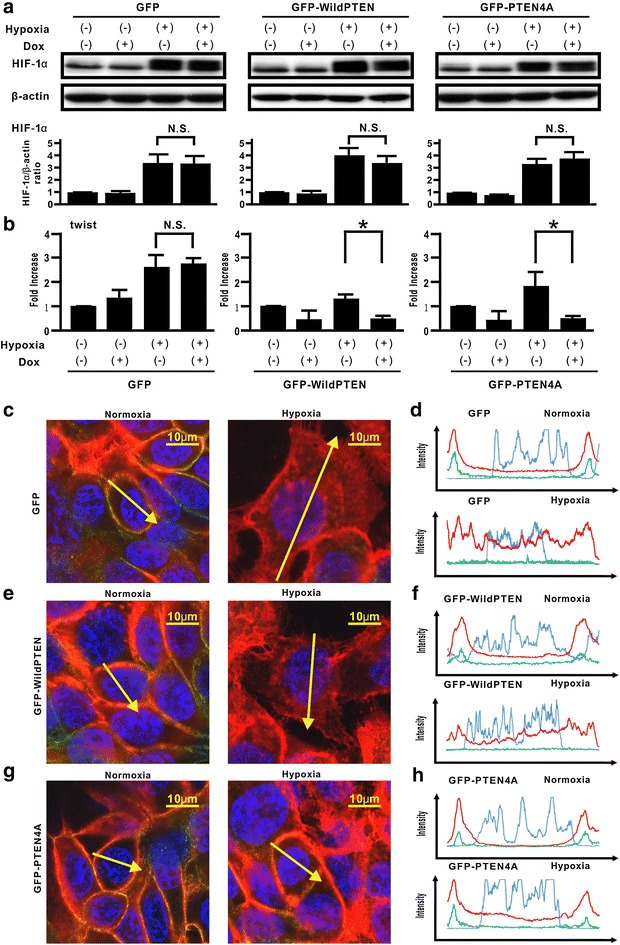
Effect of unphosphorylated PTEN on hypoxia-induced stabilization of HIF-1α expression, translocation of β-catenin, and the EMT-related gene twist expression in H358 cells. a The indicated cells were treated with vehicle or Dox for 24 h before hypoxia stimulation. And then, the cells were cultured under normoxia or hypoxia for a further 6 h in the absence or presence of Dox. Western blotting analysis for f HIF-1α was carried out. A blot is representative of three independent experiments (GFP, left; GFP-WildPTEN, middle; GFPPTEN4A, right). The ratio of HIF-1α to β-actin was compared with that in the cells cultured under normoxia in the absence of Dox. *p < 0.05 NS not significant. b The indicated cells were treated with vehicle or Dox for 24 h before hypoxia stimulation. And then, the cells were cultured under normoxia or hypoxia for a further 24 h in the absence or presence of Dox. The expression levels of twist mRNA were analyzed by using real-time PCR and normalized to GAPDH mRNA (GFP, left; GFP-WildPTEN, middle; GFPPTEN4A, right). The relative twist expressions were compared with that in cells treated under normoxia. Data represent the mean ± standard error of the mean (SEM) from three independent experiments. *p < 0.05, NS not significant. c–h The indicated cells were treated with vehicle or Dox for 24 h before hypoxia stimulation. And then, the cells were cultured under normoxia or hypoxia for a further 24 h in the absence or presence of Dox. The intensity of fluorescence of β-catenin and E-cadherin was evaluated in H358ON cells with Dox-dependent GFP (c, d), GFP-WildPTEN (e, f) or GFP-PTEN4A (g, h) was evaluated. The left and right images in c, e, g show cells under normoxia and hypoxia, respectively. The upper and lower panels in d, f, h plot the fluorescence intensity of β-catenin (red), E-cadherin (green), and nucleus (blue) over a cross section of cells under normoxia and hypoxia, respectively. Data are representative of at least three independent experiments
