
Fig. 8.
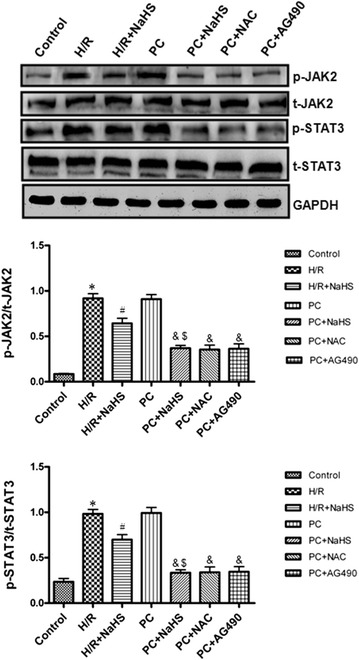
The effect of exogenous H2S on the JAK2-STAT3 pathway. The phosphorylation of JAK2 and STAT3 was detected using Western bloting. The graphs represent the optical density of the bands of phosphorylated JAK2 and STAT3 normalized with the expression of total JAK2 and STAT3, respectively. All data were from three independent experiments. *p < 0.05 vs. control group; #p < 0.05 vs. H/R group; &p < 0.05 vs. PC group; $p < 0.05 vs. H/R + NaHS group