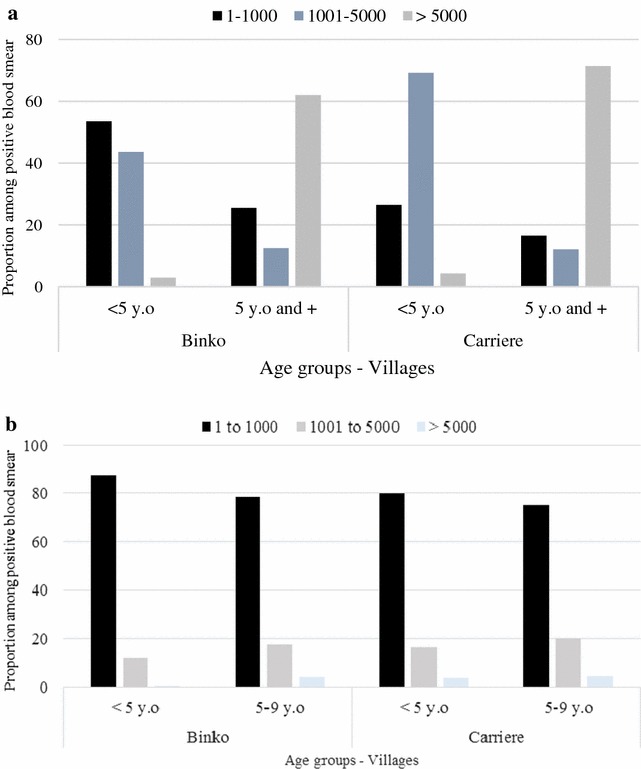
Fig. 2.

Malaria Plasmodium falciparum density/µl among age groups in October 2010 a and July 2011 b for Binko and Carrière. Number P. falciparum/µl of blood was counted in infected children classified by age group and per village. Black represent density range from 1–1000 P. falciparum/µl Blue lighter represent density range from 1001–5000 P. falciparum/µl and White darker represent density range from 5000+ P. falciparum/µl. Blue bars represent Binko and red bars represent Carrière
