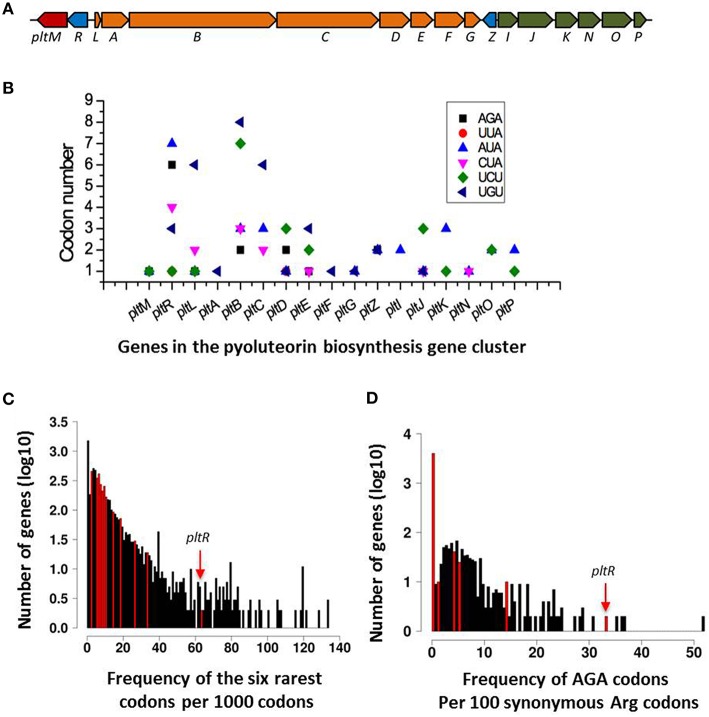
Figure 2.
Distribution of rare codons in the pyoluteorin gene cluster of P. protegens Pf-5. (A) Diagram of the pyoluteorin gene cluster of Pf-5. Colors denote genes that function in biosynthesis (orange), transport (blue), regulation (blue), or other processes (red) associated with the production of pyoluteorin. (B) Distribution of Pf-5's six rarest codons within the pyoluteorin gene cluster. (C) Frequency histogram depicting the relative abundance of rare codons for each gene in the Pf-5 genome. The six rarest codons in the Pf-5 genome are normalized to rare codons per 1000 codons and plotted in bins on the X-axis. Y-axis is the log(10)-transformed number of genes in each bin. Bins containing genes within the pyoluteorin gene cluster are colored red. Arrow shows the bin containing the pltR gene. (D) Frequency histogram of the AGA codon usage relative to all synonymous arginine codons for each gene in the Pf-5 genome. Relative AGA usage is presented as percent AGA encoded arginine along the X-axis with log(10)-transformed abundances along the Y-axis. Only genes containing at least five arginine codons were included in this plot. Bins containing genes within the pyoluteorin gene cluster are highlighted in red. Arrow shows the bin containing pltR gene.

