Fig. 3.

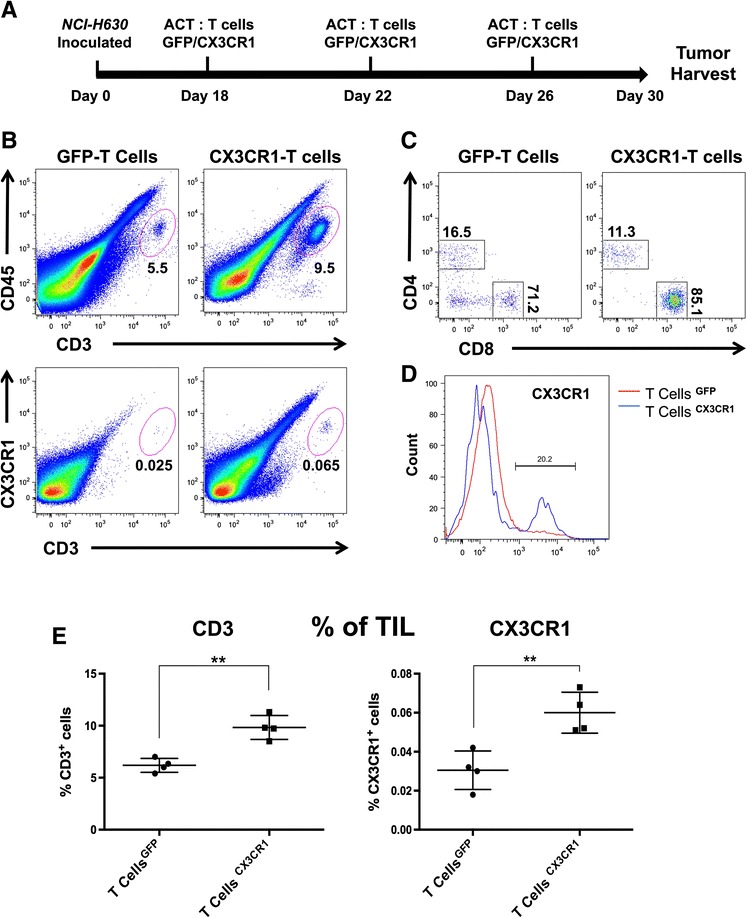
Adoptive transfer of CX3CR1-positive T cells to mice bearing NCI-H630 tumors. a Schematic representation of adoptive transfer of eGFP or CX3CR1-eGFP expressing T cells in NSG mice implanted with NCI-H630 tumors. b Representative flow cytometry plot of explanted and disaggregated tumors for the analysis of infiltrating human T lymphocytes (CD45 + CD3+/CX3CR1+) after adoptive transfer. Cells were gated on live cells, the plots show the population of CD3/CD45 positive cells and CD45/CX3CR1 positive cells within the tumors. c Proportion of CD8+ and CD4+ subpopulation within CD3 positive TILs. d Proportion of CX3CR1+ T cells in gated CD3+ tumor-infiltrating T cells (blue line: mice receiving CX3CR1-expressing T cells, red line: mice receiving eGFP-T cells CD3). e Summary of percentage of total CD3+ (left) and CX3CR1+ (right) T cells in explanted tumors after adoptive transfer, obtained from different mice (each dot represents a single mouse). +/−SEM **P < 0.01 for difference between control (eGFP) and test (CX3CR1) group (Student’s t test)
