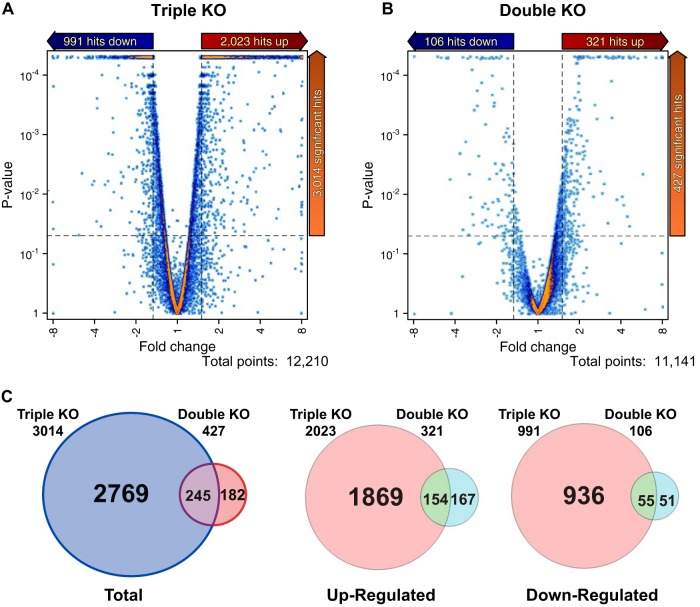
FIG 3.
(A and B) Differential transcript expression in the triple KO versus WT (A) and double KO versus WT (B) comparisons. Volcano plots of transcript expression in the two comparisons are shown. The dashed lines indicate significance cutoffs of P < 0.05 and fold change cutoffs of 1.5. Only transcripts that were expressed above the abundance cutoff of 1.5 FPKM are shown. (C) Venn diagrams of unique and common transcripts between the two RNA-Seq data sets that met these criteria.

