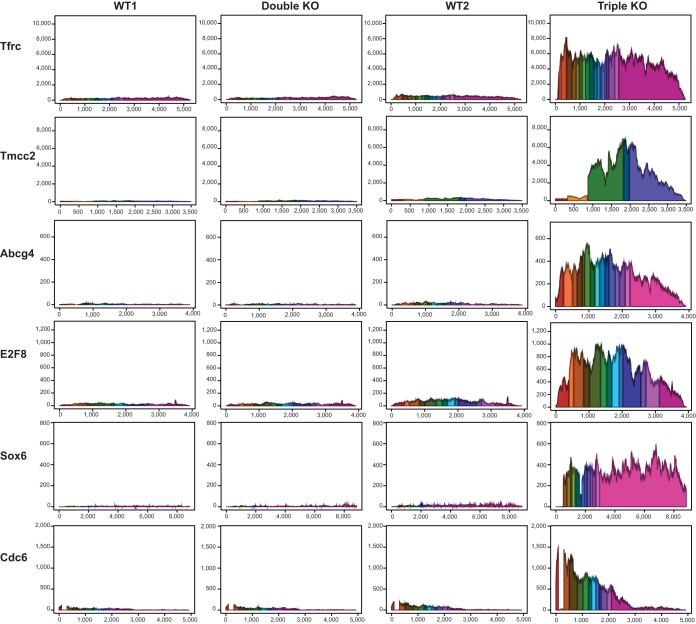
FIG 5.
Average read coverage of the annotated exons of six top potential TTP target mRNAs. The y axis represents the average sequence read depth at each position, and the x axis represents the nucleotide position along the transcript exons, including a fixed 10-nucleotide gap at each intron. Each exon in each transcript is a different color. As shown, Tfrc, Tmcc2, Abcg4, E2f8, Sox6, and Cdc6 mRNAs were by far the most abundant in the triple KO group.

