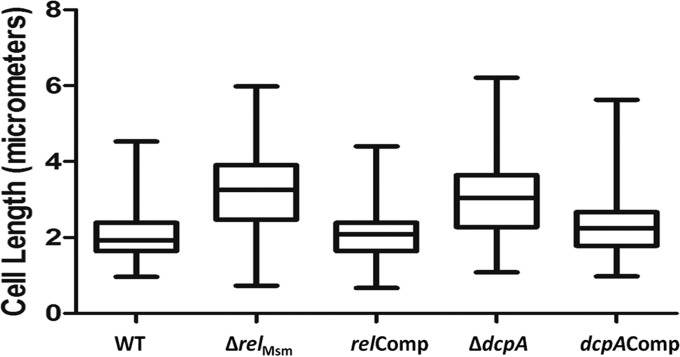
FIG 4.
Cell length distribution analysis using a box plot. Lengths of at least 200 cells of each strain from different electron micrographs were measured and plotted using the box plot analysis function from GraphPad Prism 5. The whiskers in the plot represent minimum and maximum values. The median lengths were found to be 1.92 μm for the WT, 3.24 μm for the ΔrelMsm strain, 2.08 μm for the ΔdcpA strain, 3.04 μm for the relComp strain, and 2.24 μm for the dcpAComp strain.

