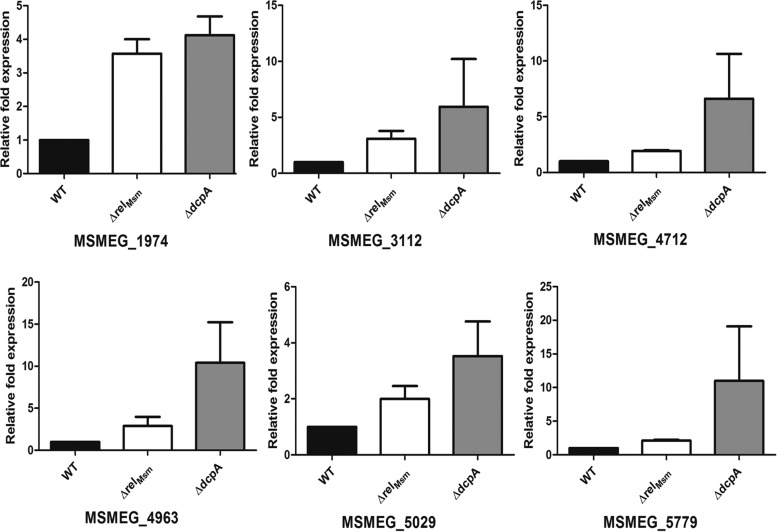
FIG 7.
Quantitative real-time PCR analysis. Six genes, upregulated more than 2-fold in the microarray, were chosen for qRT-PCR analysis. Almost all genes were upregulated in both strains by at least 2-fold, thus validating the microarray data. The experiment was performed in at least two biological replicates, and each replicate was performed in triplicate. The figure shows one of the replicates. The graphs were plotted using GraphPad Prism 5.

