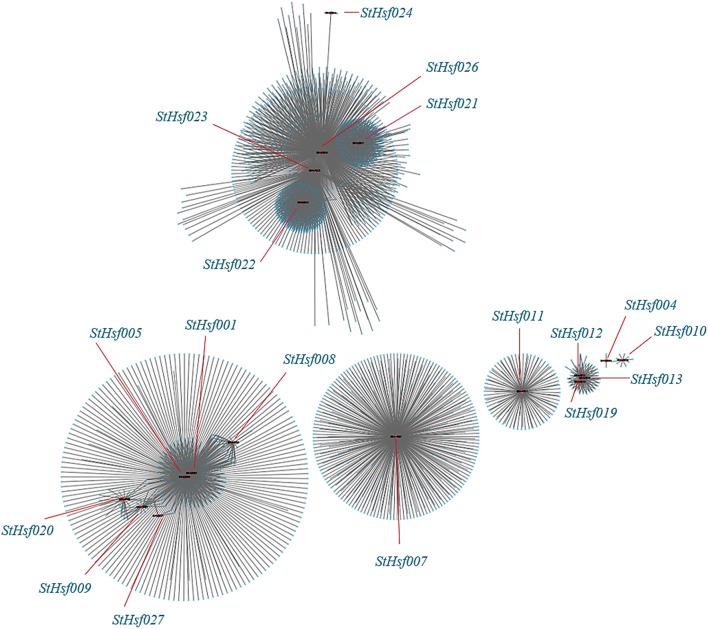
Figure 8.
Co-expression network of Hsfs and their co-expressed genes in potato. TOM (Topological overlap matrix) value is 0.07. Nodes represent StHsf and co-expressed genes in potato, edges indicate pairwise correlation constructed by WGCNA. Red circles indicate Hsfs, blue circles represent Hsps. The network was created using Cytoscape (see Materials and Methods). The length of the line segment doesn't stand for the closeness of the relationship between StHsf and each gene; it is simply for distinguishing different genes.

