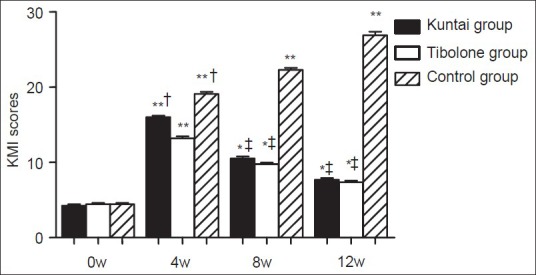
Figure 1.

Kupperman menopausal index score before and after gonadotropin releasing hormone agonist (GnRH-a) therapy. *P < 0.05, **P < 0.01 versus the same group at 0 week of GnRH-a therapy; †P < 0.05 versus Tibolone group 4 week after GnRH-a therapy; ‡P < 0.01 versus control group 8 week or 12 week after GnRH-a therapy.
