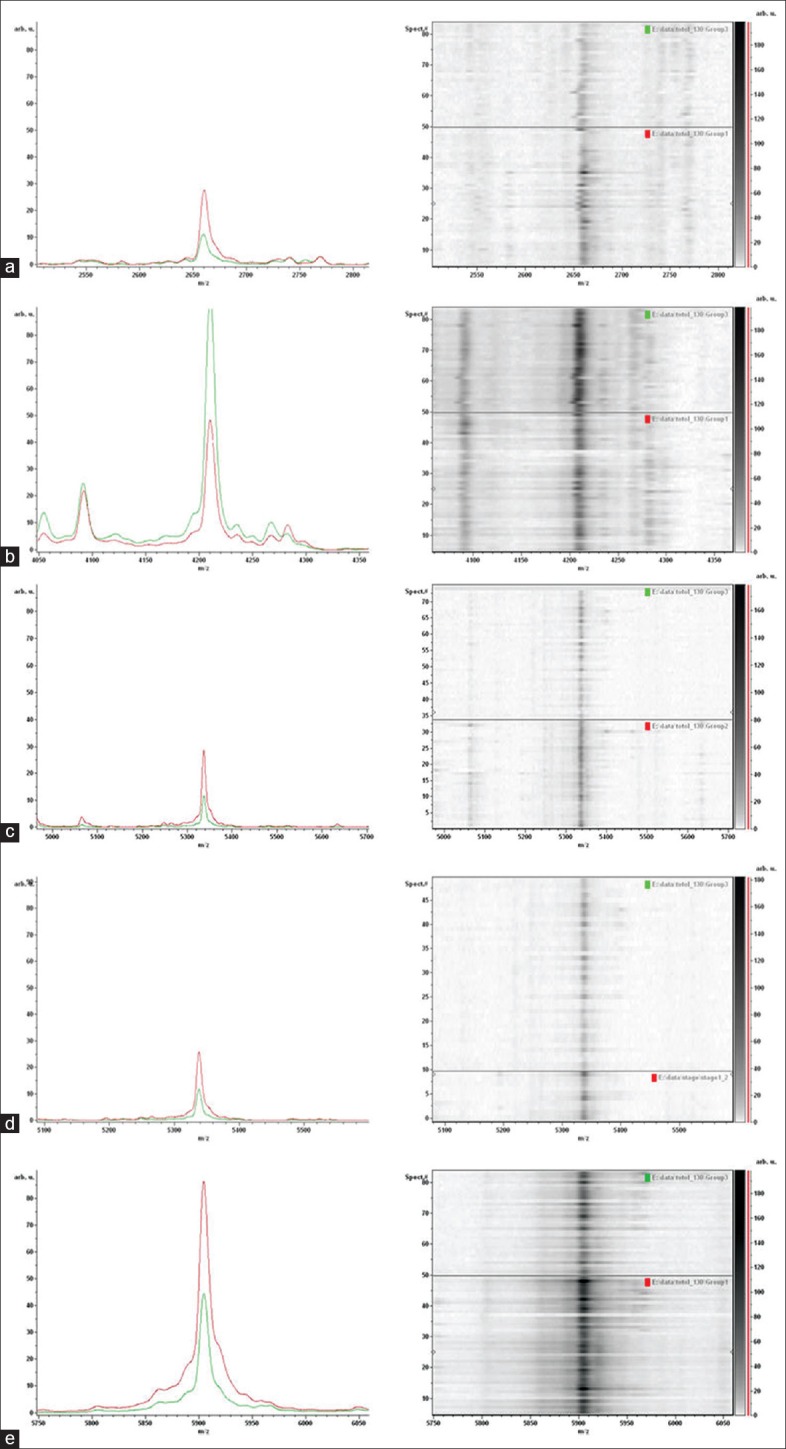
Figure 3.

Differential protein peaks in typical samples, and in electrophoresis gel bands. Left: Differential protein peaks; red: Patient samples; green: Healthy controls; Right: Electrophoresis gel bands; Upper: Healthy controls; lower: Patients. (a) 2660 Da; (b) 4210 Da; (c) 5264 Da; (d) 5635 Da; and (e) 5904 Da.
