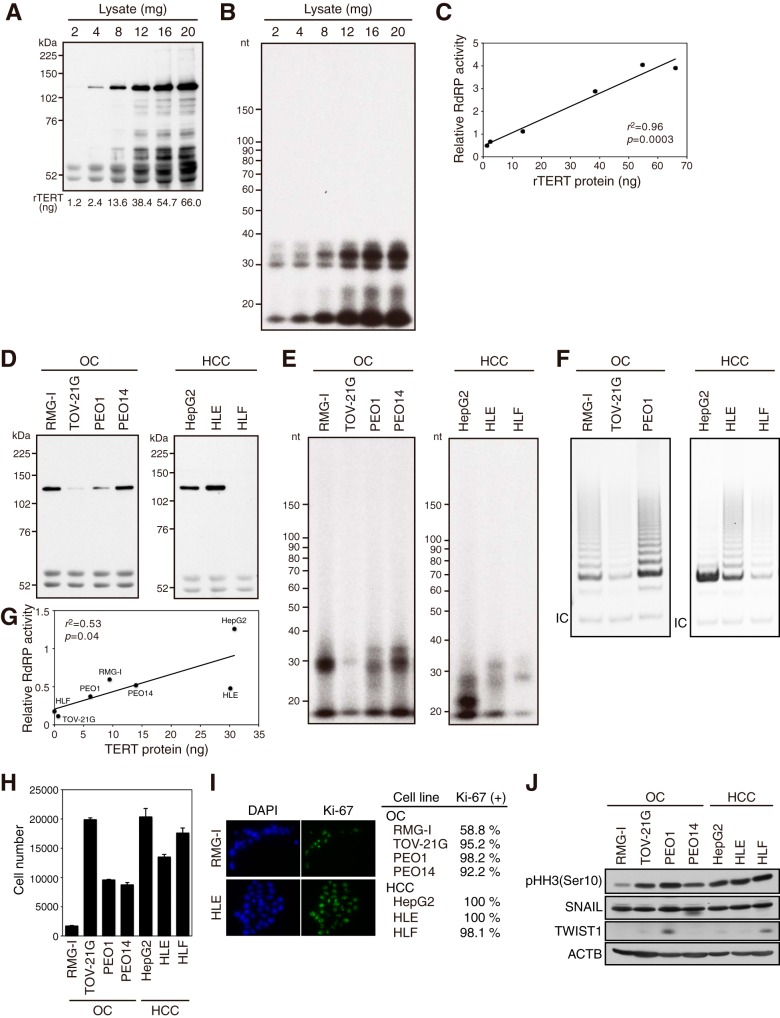
FIG 6.
TERT protein levels are correlated with RdRP activity. (A to C) Positive correlation between the level of rTERT and RdRP activity. IP-IB (A) and IP-RdRP (B) assays were performed with the indicated amounts of silkworm lysate overexpressing rTERT. The amount of rTERT immunoprecipitated from each lysate was calculated by comparing the signals obtained by IP-IB. (C) Protein levels versus relative RdRP activities for rTERT. Relative RdRP activities were plotted in arbitrary units. (D to G) Expression levels and enzymatic activities of TERT protein in OC and HCC cell lines. (D) IP-IB of OC and HCC cell lines. The signals at ≈52 kDa indicate heavy chains of IgG. (E) IP-RdRP assays of OC and HCC cell lines. (F) IP-TRAP assays of OC and HCC cell lines. IC, internal control. (G) TERT protein level versus relative RdRP activity for each of the OC and HCC cell lines. Mean values for two independent experiments were plotted. (H) Cell growth of OC and HCC cell lines as analyzed by MTT assay. (I) Ki-67-positive ratios were calculated based on immunofluorescence analysis. Representative images are shown. (J) Immunoblot analysis of OC and HCC cell lines.

