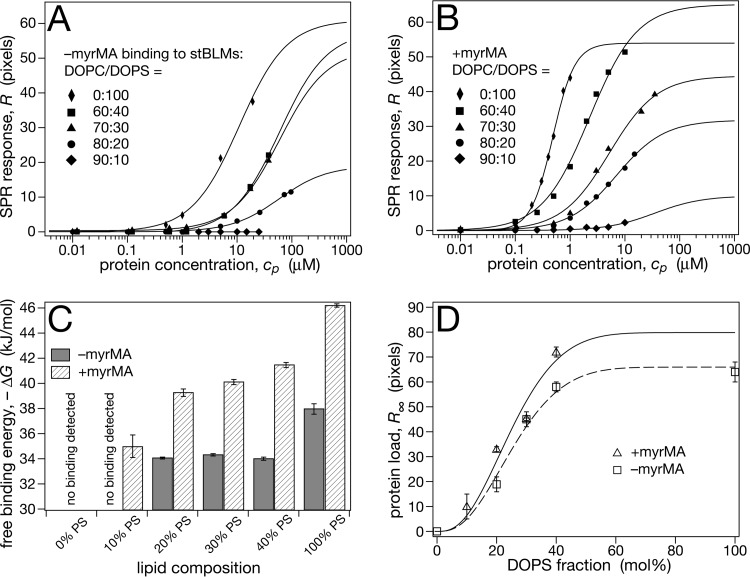
FIG 2.
Comparison of –myrMA and +myrMA binding to stBLMs that contain DOPC and DOPS. The buffer consisted of 10 mM Na2PO4 and 50 mM NaCl (pH 7.4). (A) Representative SPR curves of –myr MA binding, analyzed with the Langmuir model (equation 1). (B) Representative SPR curves for +myrMA. Binding to 100% DOPS stBLMs showed significant deviations from a Langmuir isotherm and was analyzed with the Hill model (equation 2), yielding a Hill coefficient of n ≈ 2. (C) Free binding energies, ΔG (equation 3), derived from the data shown in panels A and B. (D) Saturation protein surface densities, R∞. Lines are guides to the eye, indicating saturation of the equilibrium protein load for stBLMs containing more than ∼40 mol% DOPS. The R∞ value for +myrMA binding to a 100% DOPS stBLM is excluded from the plot, since it was determined using a different binding model. Measurements were performed at least in triplicate; error bars in panels C and D indicate standard mean deviations from the average. For low-affinity isotherms, it was not possible to measure full binding curves due to limitations in available amounts of protein.

