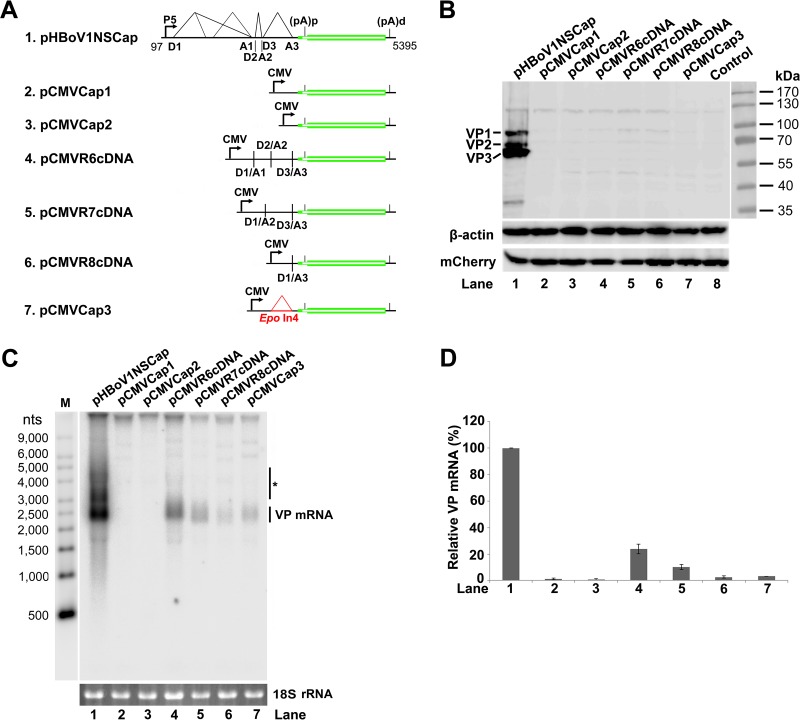
FIG 4.
HBoV1 VP cDNA constructs did not express capsid proteins. (A) Diagrams of HBoV1 VP cDNA constructs. pHBoV1NSCap is diagrammed with transcription, splicing, and polyadenylation units shown. pCMVCap1-3 and pCMVR6-8cDNA, which contain various sequences of the 5′ UTR and 3′ UTR and the VP1/2/3 ORF, are diagrammed with the junction of the 5′ and 3′ splice sites or the heterogeneous Epo intron 4 (Epo In4), as indicated. (B) Western blot analysis of capsid proteins. HEK 293 cells were transfected with plasmids as indicated. The lysates of the transfected cells were analyzed by Western blotting using an anti-VP antibody and reprobed with anti-β-actin. The lysates were also analyzed by Western blotting using an anti-HA antibody to detect the C-terminally HA-tagged mCherry. The identities of the detected bands are indicated on the left of the blot. (C) Northern blot analysis of cytoplasmic VP mRNAs. HEK 293 cells were transfected with plasmids as indicated. Cytoplasmic RNA prepared from each transfection was analyzed by Northern blotting using the Cap probe, which specifically detects VP mRNA (Fig. 1B). EB-stained 18S rRNA bands are shown, and the VP mRNA band is indicated. The asterisk denotes various NS-encoding mRNAs. An RNA ladder (M) was used as a size marker. (D) Quantification of VP mRNA expression. The bands of VP mRNA in each lane of panel C were quantified and normalized to the level of 18S rRNA. The signal intensity of the VP mRNA band in lane 1 was arbitrarily set as 100%. Relative intensities were calculated for the bands in the other lanes. Means and standard deviations were calculated from the results of at least three independent experiments.

