FIG 6.
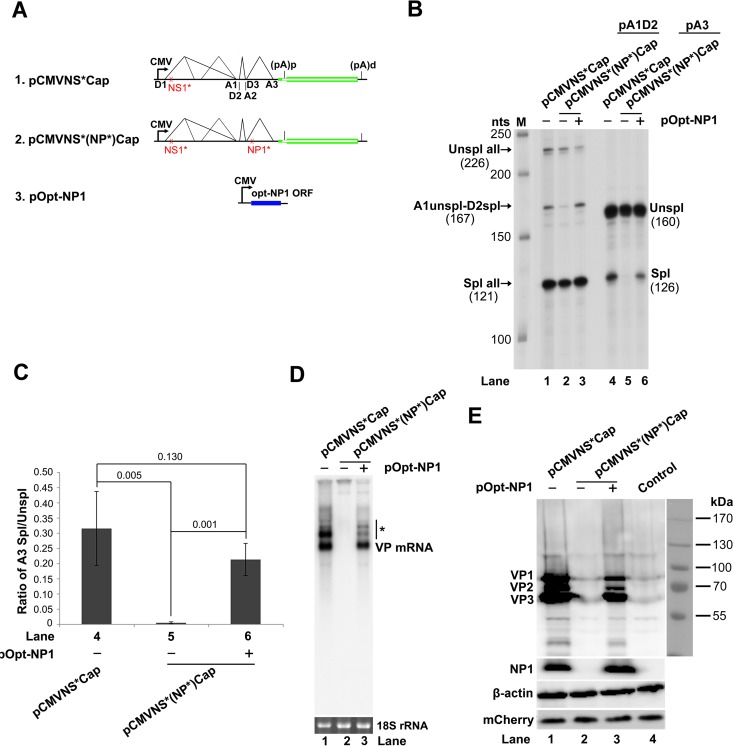
NP1 complementation rescued VP mRNA production and capsid protein expression. (A) Diagrams of HBoV1 NSCap constructs. pCMVNS*Cap and pCMVNS*(NP*)Cap are diagrammed, along with the pOpt-NP1 plasmid that expresses NP1 from a codon-optimized NP1 ORF. (B) RPA analysis of viral RNAs spliced at the A1, D2, and A3 splice sites. Ten micrograms of total RNA isolated 2 days posttransfection from HEK 293 cells transfected with plasmids as indicated was protected by both the pA1D2 and pA3 probes. Lane M, 32P-labeled RNA markers (22), with sizes indicated on the left. The origins of the protected bands in the lanes are indicated on the left and right for the pA1D2 and pA3 probes, respectively. Spl, spliced RNAs; Unspl, unspliced RNAs. (C) Quantification of the mRNAs spliced at the A3 splice acceptor. The bands of both spliced and unspliced RNAs in lanes 4 to 6 of panel B were quantified. The ratio of spliced versus unspliced RNA (A3 Spl/Unspl) was calculated and is shown with means and standard deviations from three independent experiments. The numbers shown are P values calculated using a two-tailed Student t test. (D) Northern blot analysis of cytoplasmic VP mRNAs. HEK 293 cells were transfected with plasmids as indicated and harvested 2 days posttransfection. Cytoplasmic RNA was extracted, and the RNA samples were analyzed by Northern blotting using the Cap probe. EB-stained 18S rRNA and VP mRNA are indicated. The asterisk denotes various NS-encoding mRNAs. (E) Western blot analysis of capsid proteins. Transfected cells were harvested and lysed 2 days posttransfection. The lysates were analyzed by Western blotting using an anti-VP antibody. The blot was reprobed with anti-β-actin. The lysates were also analyzed by Western blotting using anti-NP1 and anti-HA (for mCherry) antibodies. The identities of detected proteins are shown at the left of the blot.

