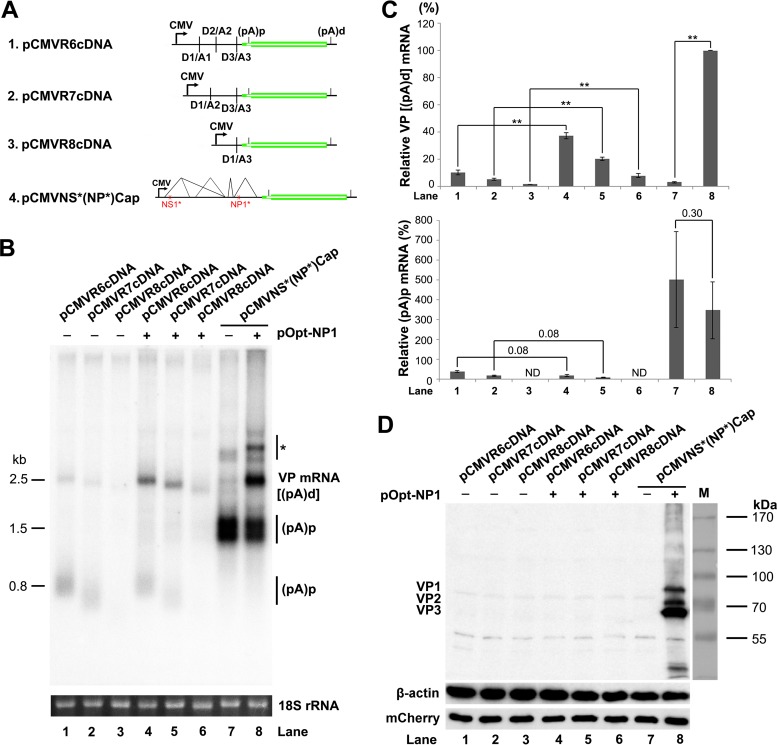
FIG 9.
NP1 increased VP mRNA production from cDNA constructs. (A) Diagrams of HBoV1 cDNA constructs, along with the pCMVNS*(NP*)Cap control. (B) Northern blot analysis of VP and (pA)p mRNAs. HEK 293 cells were transfected with plasmids, as indicated, with (+) or without (−) cotransfection of pOpt-NP1. The cells were harvested, and total RNA was extracted 2 days posttransfection. The RNA samples were analyzed by Northern blotting using the NSCap probe. EB-stained 18S rRNA bands of each sample are shown. The identities of detected bands are indicated. The asterisk denotes various NS-encoding mRNAs. (C) Quantification of VP and (pA)p mRNAs on a Northern blot. The bands of VP mRNA and (pA)p mRNA in each lane of panel B were quantified and normalized to the level of 18S rRNA. The intensity of the VP mRNA band in lane 8 was arbitrarily set as 100%. Relative intensities were calculated for the bands in the other lanes. Means and standard deviations were calculated from three independent experiments. The P values shown were calculated using a two-tailed Student t test. **, P < 0.01. ND, not detectable. (D) Western blot analysis of capsid proteins. HEK 293 cells were transfected with plasmids as indicated. The cells were harvested and lysed 2 days posttransfection. The lysates were analyzed by Western blotting using an anti-VP antibody. The blot was reprobed using an anti-β-actin antibody. The lysates were also analyzed by Western blotting using an anti-HA antibody for mCherry expression.

