
FIG 5.
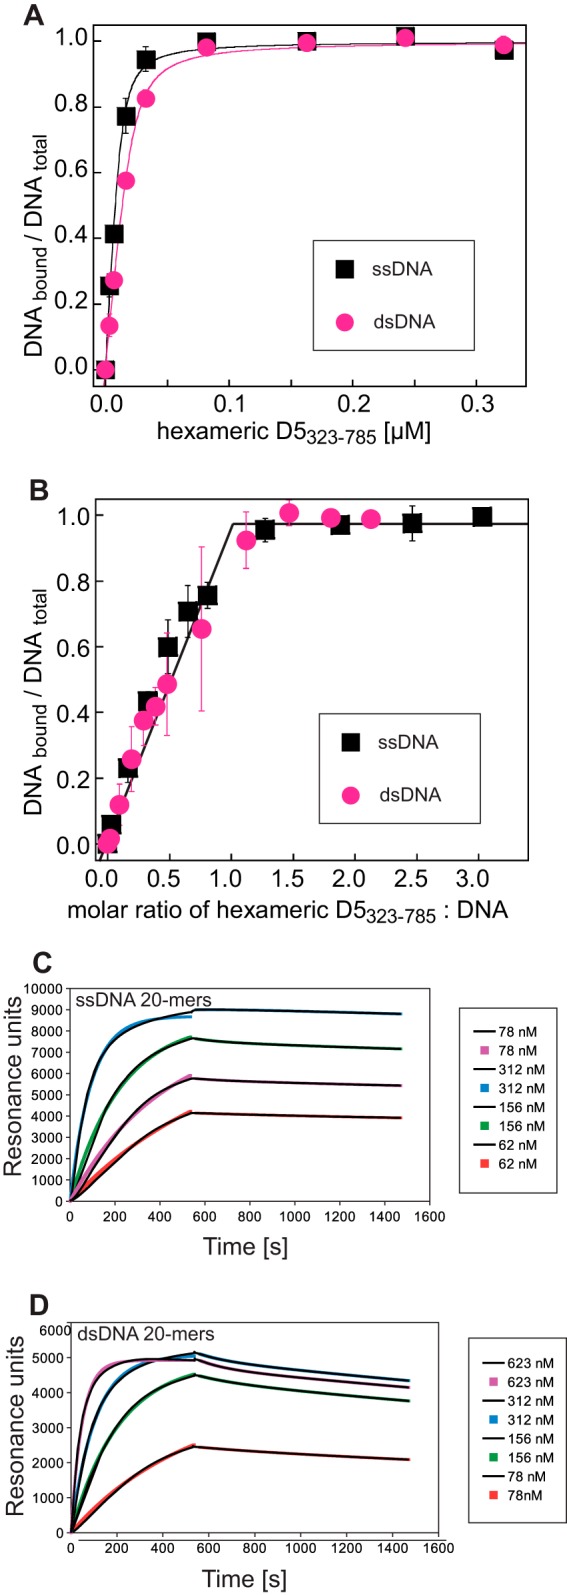
DNA binding of D5323–735 (A) Determination of the Kd of fluorescently labeled ssDNA or dsDNA oligomers using fluorescence anisotropy. (B) Determination of the binding stoichiometry. The break of the linear increase of the signal during titration indicates a stoichiometry of one DNA oligomer per hexamer. Fluorescence anisotropy measurements were performed in triplicate. Error bars indicate the standard deviation of the mean values. (C) Sensograms of an SPR experiment using biotinylated ssDNA 20-mers immobilized on a streptavidin-coated chip. Different concentrations of D5323–735 were flowed over the chip. Association phases were fitted with single exponentials. A biexponential fit was used to describe the dissociation phase, which was, however, clearly dominated by one exponential term used for the determination of the rate constant. Fitted curves use colored symbols, whereas the experimental curves are shown in black. (D) Curves corresponding to those in panel C for an experiment using immobilized dsDNA 20-mers.