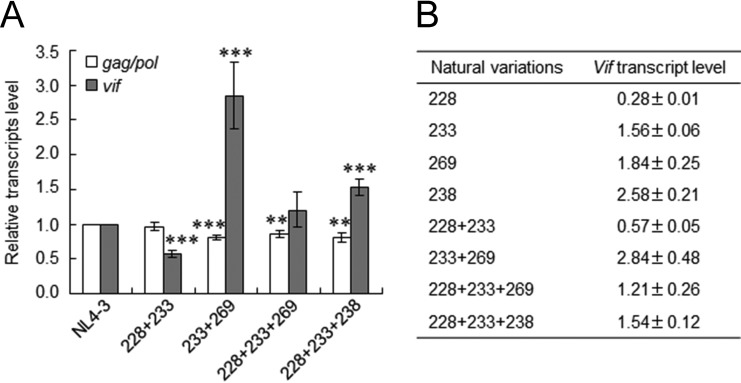
FIG 5.
Effects of naturally occurring combinations of variations in SA1prox on vif transcript levels. (A) vif transcript levels. RNA samples were prepared from HEK 293T cells transfected with the proviral clones indicated, as described in the legend of Fig. 4, and subjected to qRT-PCR analysis using primer pairs specific for gag/pol (NL-9kb in Fig. 1) and vif (NL-vif in Fig. 1) transcripts. The expression levels of all HIV-1 transcripts (NL-U in Fig. 1) and GAPDH were analyzed by qRT-PCR in parallel for transfection and internal controls, respectively. The expression levels of gag/pol and vif transcripts in each sample were normalized by those of all HIV-1 transcripts and GAPDH. gag/pol and vif transcript levels relative to those of NL4-3 are presented. Mean values ± standard deviations from three independent experiments are shown. Significance relative to NL4-3 was determined by the Student t test (***, P < 0.01; **, P < 0.05). (B) Quantification of vif transcripts. vif transcript levels relative to that of NL4-3 for single (Fig. 4C) and combination (see above) variants determined by qRT-PCR are shown. 228, R228aga; 233, P233cct; 269, R269Kaag; 238, P238ccg; 228 + 233, R228aga+P233cct; 233 + 269, P233ccc+R269Kaag; 228 + 233 + 269, R228aga+P233cct+R269Kaag; 228 + 233 + 238, R228aga+P233cct+P238ccg.

