FIG 2.
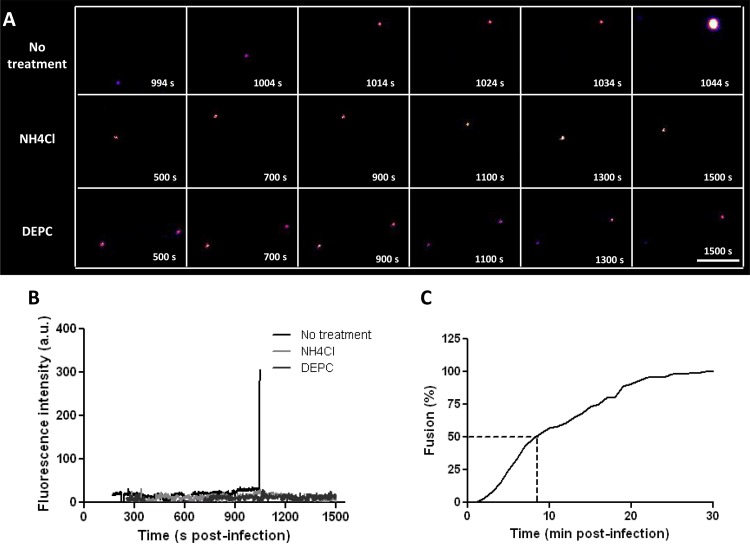
CHIKV cell entry and membrane fusion in BS-C-1 cells. (A) Filmstrips showing the fluorescence intensities of DiD-labeled CHIKV particles over time. In the top filmstrip, an increase in fluorescence intensity, indicative of membrane fusion, is seen at 1,044 s postinfection. The center and bottom strips show the DiD signals in NH4Cl-treated cells and for DEPC-inactivated CHIKV, respectively. Virus particles were tracked until 1,500 s postinfection. Images are artificially colored in order to show differences in fluorescence intensity clearly, with purple and yellow representing low and high intensities, respectively. Bar, 5 μm. (B) Fluorescence intensities of the particles shown in panel A, plotted against time. (C) Percentage of fused CHIKV particles as a function of time. In total, 113 trajectories were analyzed. The time of fusion was defined as the moment when the fluorescence intensity increased >2-fold within 1 to 2 s.

