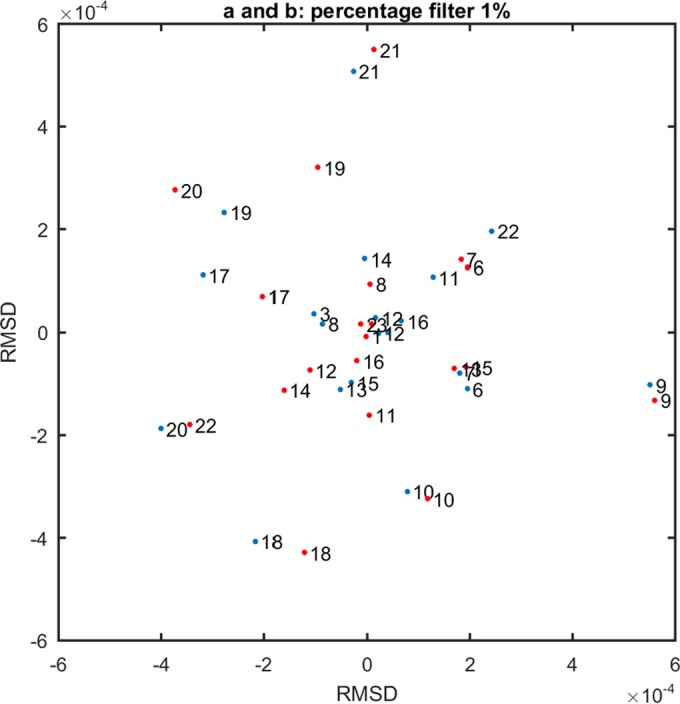
FIG 5.

Multidimensional scaling using root mean square deviation (RMSD) values calculated using significant minority variants (>1%) for data set a (red dots) and b (blue dots). Numbers represent the 20 studied samples ordered by collection time, as indicated in Table 1. Samples 4 and 5 that correspond to a different lineage were excluded.
