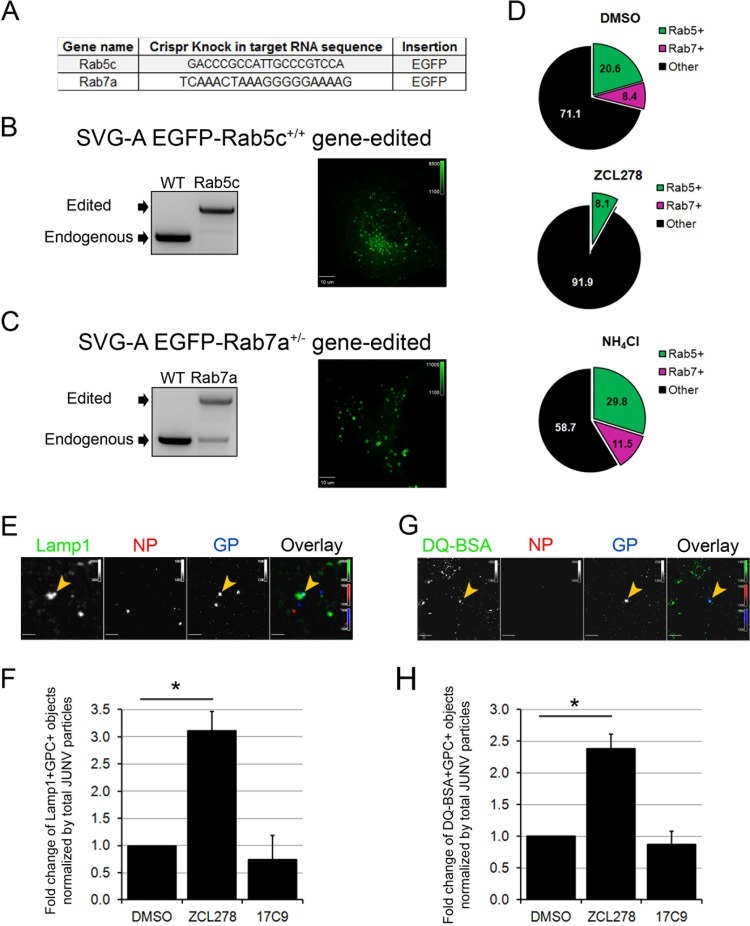
FIG 7.
JUNV particles are mostly absent from early and late endosomes but are enriched within lysosomal compartments in ZCL278-treated cells. (A) Gene names and the sequences of the target gRNA used to insert the EGFP and a linker consisting of the amino acid sequence GGSGGSGGS upstream of their ATG codons by homologous recombination in SVG-A cells. (B, C) SVG-A cells were cotransfected with a plasmid coding for Cas9, a linear PCR product coding for the specific gRNAs targeting a region near the ATG codon of either Rab5c or Rab7a under the control of the U6 promoter, and a template plasmid containing the EGFP sequence flanked by 800 bp upstream and downstream of the region targeted (see Materials and Methods for details). Monoclonal populations were expanded and screened for endogenous/edited alleles by genomic PCR with primers specific for Rab5c (B) or Rab7a (C). (Right) Snapshots of the EGFP fluorescence distribution for each cell type acquired by spinning disk confocal microscopy. The dynamics of the EGFP-positive vesicles are shown in Movies S1 and S2 in the supplemental material. (D) SVG-A cells edited for EGFP-Rab5c+/+ and EGFP-Rab7a+/− were pretreated for 15 min and then infected with JUNV-A647 for 30 min in the presence or absence of 50 μM ZCL278 or 20 mM NH4Cl. The cells were then washed, fixed, and stained with an anti-NP antibody coupled to A568. Images were acquired by spinning disk confocal microscopy, and the number of JUNV particles positive for A647 and A568 (NP+ and GP+ objects) were quantified visually using the same contrast settings. The percentages of the NP+ and GP+ objects that also contained an EGFP signal are represented in a pie chart, in which the green slice accounts for Rab5c-positive (Rab5+), NP+, and GP+ objects and the pink slice accounts for Rab7a-positive (Rab7+), NP+, and GP+ objects. Each condition represents data collected from 10 fields of view, in which more than 120 GP+ particles were quantified. (E, F) SVG-A cells were treated as described in the legend to panel D and stained with an anti-NP antibody coupled to A548 and a rabbit anti-Lamp1 antibody, detected with a secondary anti-rabbit IgG antibody coupled to A488. (E) Images were acquired by spinning disk confocal microscopy. Yellow arrowheads, Lamp1-positive and GP+ objects. (F) The number of Lamp1-positive and GP+ objects normalized by the total number of GP+ and NP+ particles. Statistical analysis for significance was performed using the two-tailed Student t test. *, P < 0.05. (G, H) SVG-A cells were prepared as described in the legend to panel D, but inoculation of JUNV-A647 was performed in the presence of green DQ-BSA. (G) A representative snapshot. Yellow arrowheads, DQ-BSA-positive GP+ objects. (H) The number of DQ-BSA-positive and GP+ objects normalized to the total amount of GP+ and NP+ particles. Statistical analysis for significance was performed using the two-tailed Student t test. *, P < 0.05.

