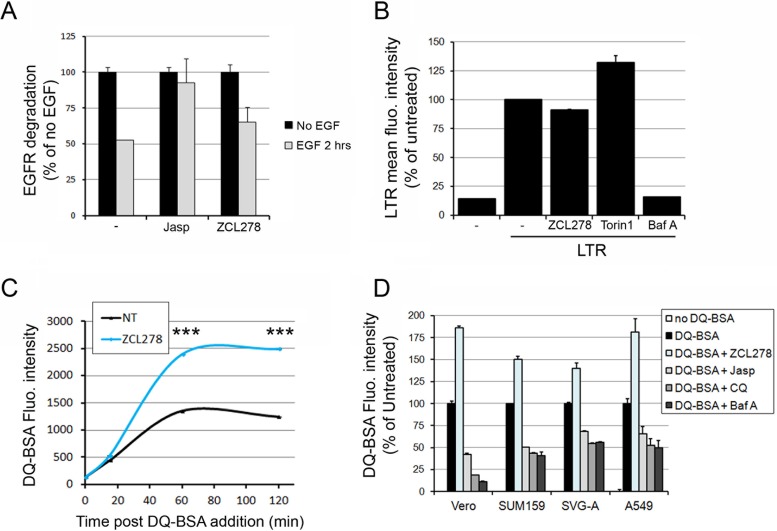
FIG 8.
ZCL278 increases the degradation of exogenous DQ-BSA but not endogenous EGFR independently of endosomal acidification. (A) The amount of EGFR in the absence (black bars) or presence (gray bars) of EGF was measured by flow cytometry in cells treated with the indicated compounds. The histogram represents the A647 mean fluorescence intensity and reflects the amount of EGFR per cell normalized to that for the control not treated with EGF for each condition. Data correspond to the means ± SDs from duplicate experiments with at least 10,000 cells per condition. (B) SUM159 cells were treated with 50 μM ZCL278, 10 μM 17C9, 250 nM Torin1, or 100 nM bafilomycin (Baf A) for 1 h 15 min at 37°C (similar to the time used during the JUNV infection experiments for which the results are depicted in Fig. 3D), and the acidic compartments were stained with LTR. The histogram represents the cellular mean fluorescence intensity of LTR measured by flow cytometry for each condition. The data correspond to the means ± SDs from duplicate experiments with at least 10,000 cells per condition. Torin1 treatment induced higher LTR fluorescence levels than the other treatments, as has been previously observed (46), while ZCL278 had no effect on LTR staining. (C) Vero cells were untreated or pretreated with 50 μM ZCL278 and subsequently incubated for 15, 60, or 120 min with 10 μg ml−1 green DQ-BSA in the presence (blue line) or absence (black line) of the compound. The cells were analyzed by flow cytometry, and the curves represent the mean fluorescence intensity of 488-nm laser-excited cells, which is proportional to the amount of DQ-BSA degraded at the indicated time points after DQ-BSA addition. The data correspond to the means ± SDs from duplicate experiments with at least 10,000 cells per condition. Statistical analysis using the two-tailed Student t test shows significance differences. ***, P < 0.0005. (D) Vero, SUM159, SVG-A, or A549 cells were pretreated for 15 min with 50 μM ZCL278 or 1 μM Jasp or pretreated for 2 h with 100 μM chloroquine (CQ) or 100 nM Baf A. The cells were then coincubated for 1 h with 10 μg ml−1 green DQ-BSA in the presence of the indicated drugs. The histogram represents the DQ-BSA mean fluorescence intensity normalized by that obtained under the untreated condition for each cell type. The data correspond to the means ± SDs from duplicate experiments with at least 10,000 cells per condition.

