FIG 3.

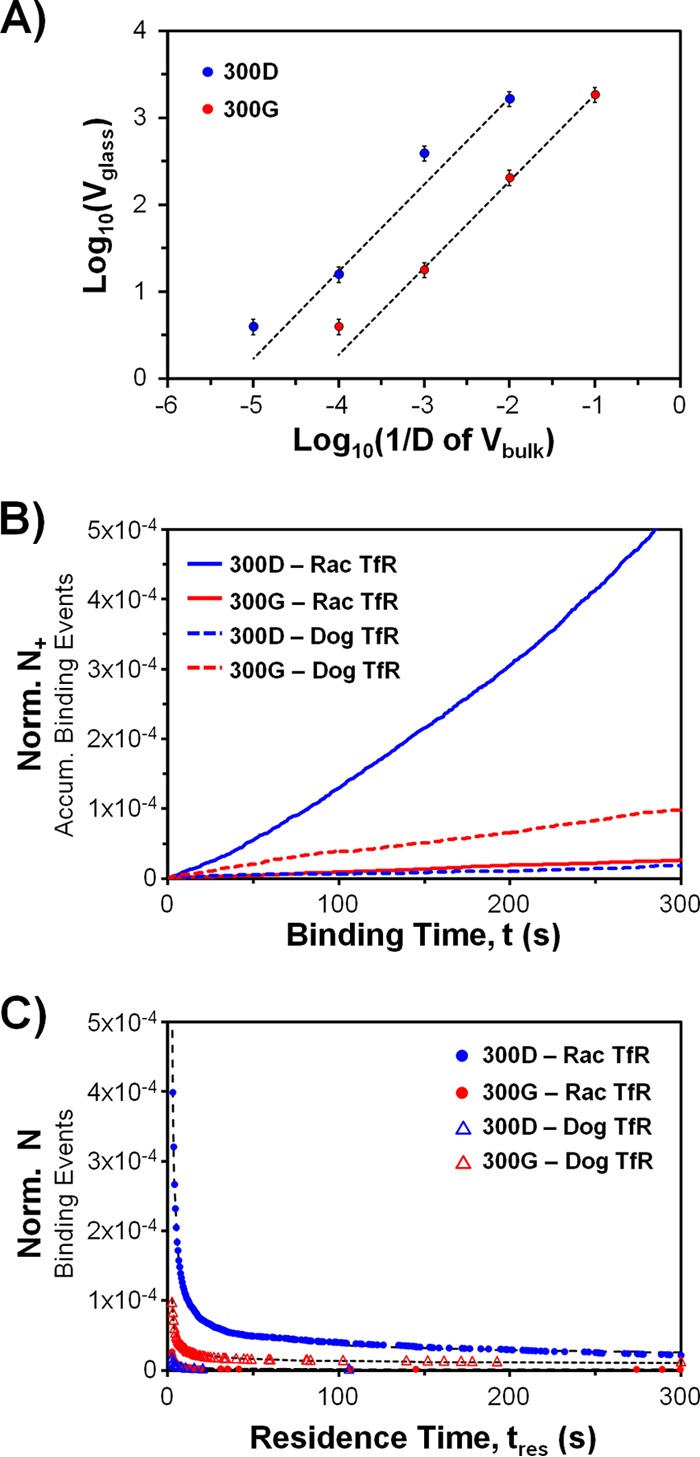
Kinetics of virus binding to raccoon or domestic dog TfR-loaded SLBs. (A) Calibration curve to show the linear relationship between Vglass and Vbulk. We measured Vglass at several dilution factors, D, of Vbulk for the Rac118-300D and -300G stock viruses. The dotted fit lines (y = mx) have R2 values greater than 0.98. The m parameters for 300D and 300G virus are 169,250 and 18,660, respectively. (B) Normalized binding rate data. Ron,norm is calculated using the linear fit of the data (Norm N+ = Ron,normt). Ron,norm values, in the order of the symbol key, are (1.6 ± 0.2) × 10−6 s−1, (9.1 ± 1.3) × 10−8 s−1, (5.9 ± 0.9) × 10−8 s−1, and (3.4 ± 0.5) × 10−7 s−1. The R2 values for linear fits are >0.98 for all cases. The error ranges were calculated via propagation of worst-case 10% errors in each Vglass and RTfR due to particle detection software limitations. The true error is expected to be less, since errors are corrected manually. (C) Normalized binding residence time distributions. The plot shows how many binding events, N, last longer than a certain residence time, tres. The data are fitted according to equation 2 (dotted lines) but in normalized form. The fit parameters (with 95% confidence intervals) and the number of binding events included in each distribution (Nbe), in the order of the symbol key, are A = 1.66 ± 0.01, B = 7.52 ± 0.01, Nbe = 2151; A = 1.91 ± 0.07, B = 5.20 ± 0.03, Nbe = 203; A = 1.57 ± 0.19, B = 3.39 ± 0.07, Nbe = 36; and A = 1.27 ± 0.03, B = 5.77 ± 0.02, Nbe = 345. The R2 values for equation 2 fits are >0.97 for all cases.
