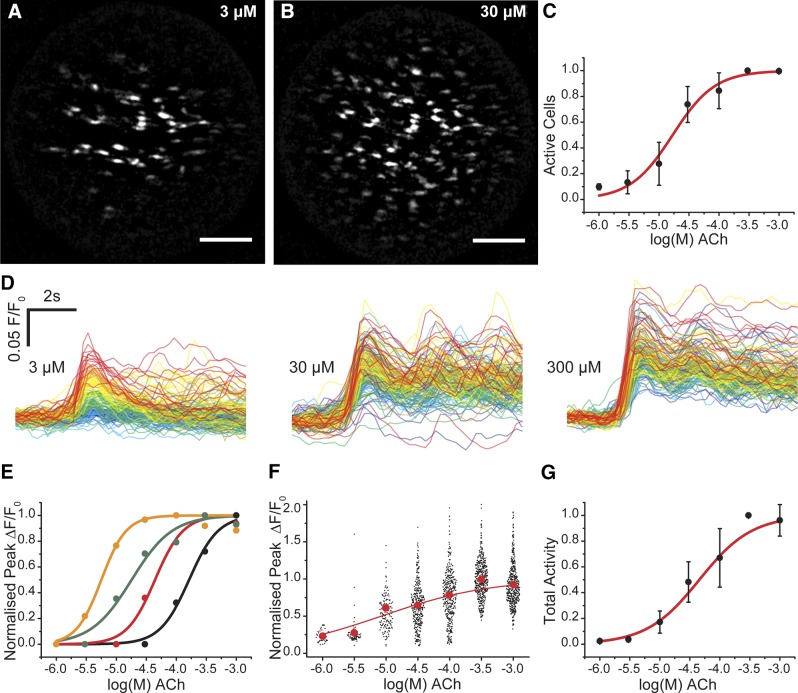
Figure 3.
Graded concentration responses to ACh. A–C) As the concentration of ACh increased, the number of cells activated increased. A, B) Maximum intensity projections show the total number of cells activated at 3µM (A) and 30 µM (B) ACh. As the concentration of ACh increases, more cells are activated. Scale bars, 100 μm. C) Summarized data showing number of active cells (EC50 = 18.9 μM; 95% confidence interval, 7.25–49.4 μM; n = 3). D) The amplitude of response in each cell also increased with concentration of ACh. The responses to 3 illustrative concentrations from the full concentration–response relationship are shown. The responses in each cell have been time-aligned and color-coded based on ACh sensitivity of the cells at the lowest ACh concentration: red, most sensitive; blue, least sensitive. As the concentration of ACh increases, the amplitude of the responses increases. There is overlap in the response between 30 and 300 μM because of the position in the concentration response relationship. E) Representative concentration responses from 4 cells in 1 experiment that show a range of sensitivities to increasing ACh concentration. F) Scatter plot of the overall responses from 445 cells from 3 arteries. The red dots plot the mean response at each concentration. The overall relationship appears flat because all responses at each concentration from separate arteries are shown. G) Total endothelial responses (EC50 = 42.7 μM; 95% confidence interval, 20.2–90.1 μM; n = 3) derived from the product of the number of active cells (C) and mean response (F) at each concentration.

