Figure 4.
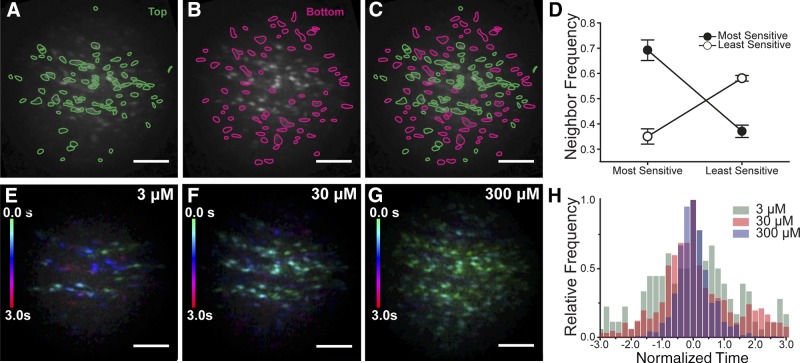
Endothelial cells cluster based on sensitivity and activate in spatially discrete ensembles. A–D) Cells of comparable sensitivity cluster. A) Plot of the grouping of cells with the highest sensitivity to ACh (top 50%). B) Plot of the cell grouping with the least sensitivity to ACh (bottom 50%). C) Composite of plots A and B. D) Plots of neighbor frequency for the high- and low-sensitivity cells normalized to the mean number of neighbors of all cells. Cells of a given sensitivity type (high or low) have significantly more neighbors of the same type. The most sensitive cells (top 50%) have more most-sensitive neighbors and fewer least-sensitive (bottom 50%) neighbors. The least-sensitive cells (bottom 50%) have more least-sensitive neighbors and fewer most-sensitive (top 50%) neighbors. E–G) Maximum intensity projection Ca2+ wave fronts showing the number of active cells at each concentration. At each concentration, all cells that respond are shown. Cell activity has been color-coded based on the time each cell is activated (green, early; red, late; color scale left side of each frame). The temporal Ca2+ pattern to 3 concentrations of ACh (3 µM, E; 30 µM, F; 300 µM, G) from the same cells shown in the upper panels (A–C). In each panel (E–G), all cells that respond to ACh are shown. At the lowest concentration (3 µM) a small number of cells initially respond (green cells). These cells then recruit some additional cells (purple and red cells). As the concentration of ACh increases (30 µM, F) more cells are activated initially (green), and these recruit additional cells (blue). At the highest concentration, almost all cells respond almost immediately (green). The decrease in time for activation of the field reveals the increased recruitment of lower sensitivity cells with higher ACh concentrations. Scale bars, 100 µm. H) Normalized frequency distribution illustrating the decreased temporal spread of cellular activation with increasing concentrations of ACh. Three increasing concentrations of ACh (3, 30, and 300 μM; n = 6) are shown. The data are a normalized frequency distribution showing the time to peak response for each cell in the endothelium.

