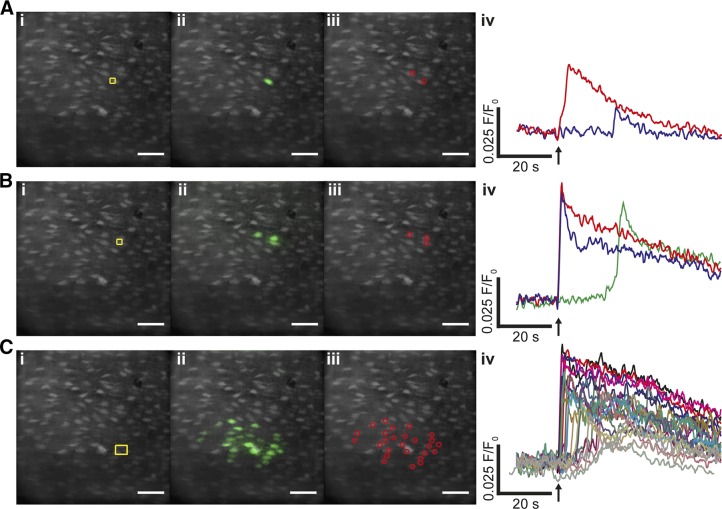
Figure 8.
Local photolysis of caged IP3 triggered [Ca2+]c increases, which propagate to neighboring cells. A) In a field of endothelial cells, locally photolyzed caged IP3 in a single endothelial cell (i, yellow box) increased [Ca2+]c in the activated cell (ii, green; iv, red) and a smaller response in an adjacent cell (iv, blue). The time course of the [Ca2+]c changes, from the cells indicated by the regions of interest (iii), are shown in the line trace (iv). Immediately after photolysis (iv, ↑), a Ca2+ rise occurred in the activated cell, and a subsequent rise occurred in an adjacent cell some 20 s later. The Ca2+ changes in ii show all Ca2+ activity (i.e., each cell that responds is shown irrespective of time of response). B) IP3 photoreleased simultaneously in 2 adjacent cells (i, yellow box) evoked a Ca2+ rise in each of the activated cells (ii, green; iv, red and blue lines) and Ca2+ rise in a neighboring cell (green) some 20 s later. The time course of the [Ca2+]c changes, from the cells indicated by the regions of interest (iii), are shown in the line trace (iv). C) Photolyzed caged IP3 in 4 cells simultaneously (i, yellow box) evoked a local Ca2+ increase, which rapidly propagated to a substantial number (∼18) of neighboring cells (ii–iv). The Ca2+ changes extended several cell lengths from the photolysis site (i, ii). The time course of the [Ca2+]c changes, from the cells indicated by the regions of interest (iii), are shown in the line trace (iv). Scale bars, 50 µm.

