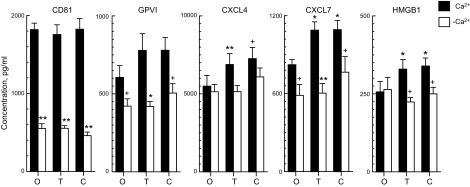
Figure 1.
Calcium dependence of platelet exosome secretion and exosome cargo levels in vitro. Each column and error bar depicts the mean ± sem for results with platelets from 6 healthy subjects. Values for GPVI, CXCL4, CXCL7 and HMGB1 were normalized for CD81 levels in the same samples. O, no additive; T, thrombin added; C, collagen added. Statistical symbols over the left, shaded columns show significance of difference between level with and without additive, determined by a paired Student’s t test. Statistical symbols over the right, open columns show significance of difference between level with and without (−)Ca2+, determined by a 2-sample Student’s t test. +P < 0.05; *P < 0.01; **P < 0.001.

