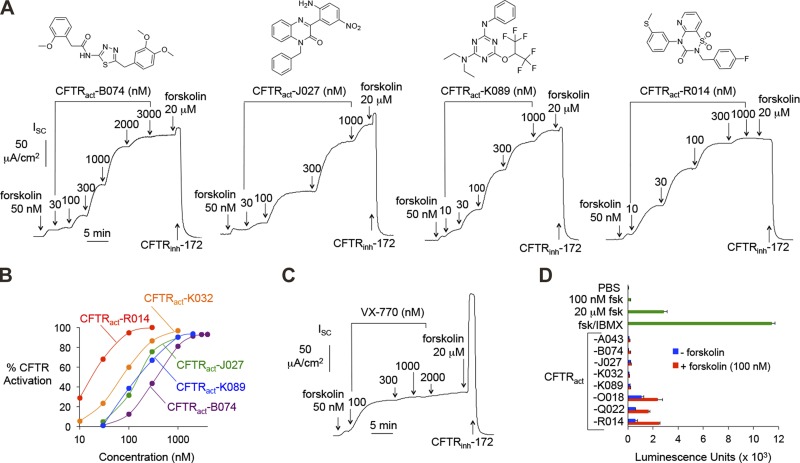
Figure 2.
In vitro characterization of CFTR activators. A) Top: chemical structures. Bottom: representative Isc measured in FRT cells expressing WT CFTR. CFTR current was stimulated by test compounds and FSK and inhibited by CFTRinh-172 (10 μM). B) Concentration-dependence of CFTR activators. Each data set derived from a single dose–response experiment as in (A) and fitted to an exponential curve. One-hundred percent CFTR activation is defined as that produced by 20 μM FSK. C) Isc measurement for VX-770, as in (A). D) Cellular cAMP concentration in FRT cells in response to incubation for 10 min with 5 µM test compounds without or with FSK (100 nM). Positive controls included FSK (100 nM and 20 μM) and FSK+IBMX (100 μM) (n = 4–8). Means ± sem.

