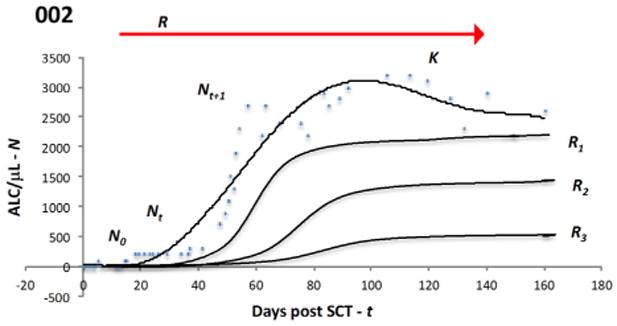
Figure 4.

Logistic model of lymphocyte proliferation post-transplant. Cell dose infused at the time of SCT N0 will start proliferating under the influence of the driving parameter R and expand over time t, taking on values of Nt, Nt+1,., Nt+n. This will include a period of exponential expansion as the lymphopenic state after SCT is corrected and eventually a stable lymphocyte population K is established. Changes in antigen presentation (due to infection, tissue injury) and immunosuppression levels and the overall cytokine milieu may perturb the steady state or growing populations by altering R and result in greater variability seen at specific time points. Reconstitution of the lymphocyte subset populations by differentiation of hematopoietic cells also changes N. The curves represents an average of the lymphoid cell populations (and clones) seen in circulation, with each population repopulating with similar dynamics but at different rates. Three other hypothetical curves along the continuum of logistic expansion are also shown with different N0 (not evident due to scale) and R values (R > R1 > R2 > R3). Blue circles and top curve depict data from an actual patient.
