
Figure 14.16.
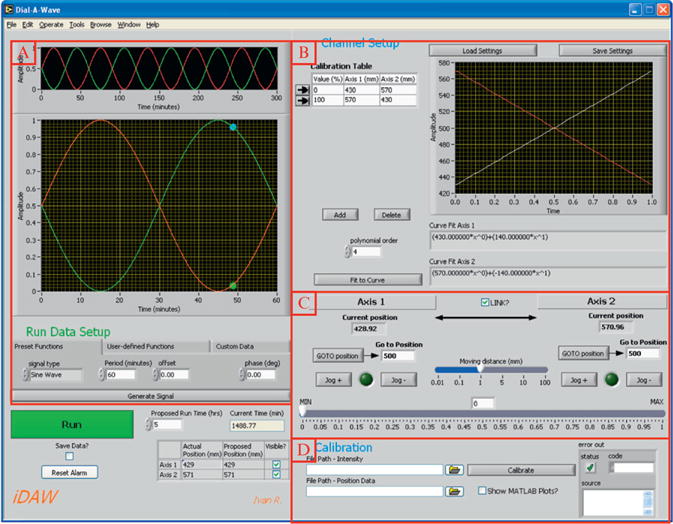
Screenshot of iDAW software. (A) Experimental parameter setup allows user to set up mixing ratios as a function of time. Most mathematical functions or an arbitrary dataset can be used as templates. (B) Manual calibration. The table records the calibration points and the graph shows the calibration functions. In this example, a two point calibration was used to create a linear calibration profile. (C) Actuator controls allow the actuators to be moved independently or together when in “Linked” mode. (D) Automatic calibration functions take position data from the actuators and fluorescence data from the microscope to determine the calibration profiles.