
Figure 14.6.
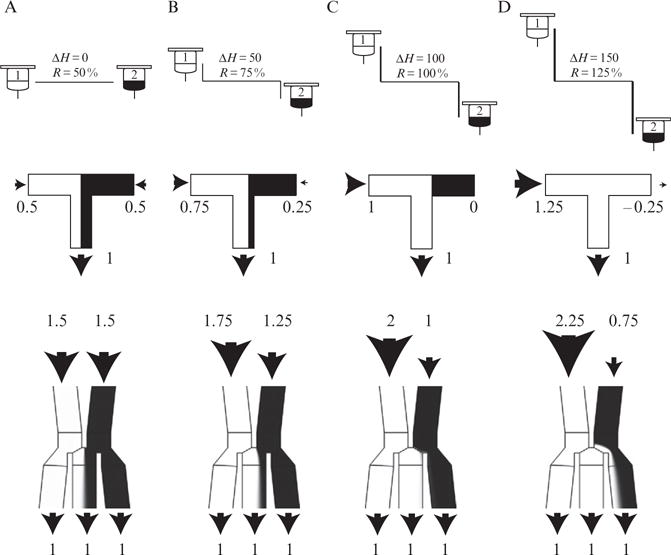
Comparison of a T-junction to our improved DAW junction for combining different source fluids in precise ratios. The figure depicts four mixing ratios from 50% to 125% and compares the performance of each junction. Note that since the system is symmetrical, flows for mixing ratios from −25% to 50% will be the reverse of those shown here. Mixing ratios above 100% or below 0% indicate complete diversion of one of the inputs to the shunt. deltaH (please write it as greek lowercase delta and english uppercase H) is an arbitrary unit of distance. (A). Mixing ratio of 50% (R = 50%), corresponding to equal flows from both reservoirs. A fluorescent dye has been added to reservoir 1, displayed in white as it would be seen under the microscope. Top portion of the figure depicts the reservoirs at equal height (ΔH = 0). Middle portion of the figure depicts a T-junction, each input flow is 0.5 nl/s, for a total flow of 1 nl/s. Bottom portion represents the DAW junction. Each inlet has a flow of 1.5 nl/s, for a total inlet flow of 3 nl/s. Note the smooth interface between fluid streams, as diffusion has not yet been able to cause appreciable mixing. (B) Mixing ratio of 75%. The height of the port 1 reservoir has increased while the corresponding port 2 reservoir has decreased by an equivalent amount. Both junctions continue to perform well. Note that the flow rate in inlet 1 has increased in the exact amount it has decreased in inlet 2. (C) Mixing ratio of 100%. The T-junction fails here as the flow rate in input 2 has dropped to zero. In practice, zero flow is unattainable and will likely result in a backflow situation. Note the DAW junction continues to perform well, since all flow from input 2 is directed into a shunt. (D) Mixing ratio of 125%. At this point backflow has occurred in the T-junction, as flow from port 1 begins to enter the input 2 source. In the DAW junction, the excess flow from input 1 is directed into a shunt and flow continues from input 2. Note that the output of the junction directed to the cell chamber will be the same in both C and D (center channel). This is why the output in the cell chamber seems to plateau after increasing ΔH beyond the 100% level.