
Figure 14.7.
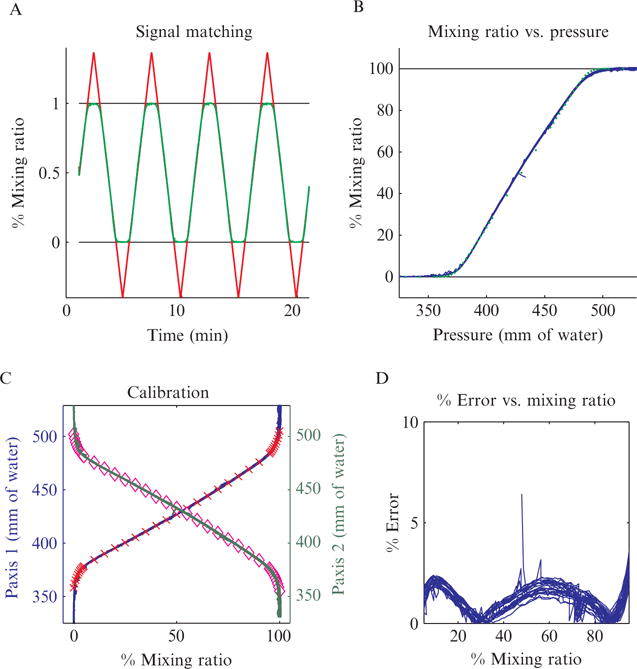
Performance of the DAW junction. (A) Calibration signal (red line) overlaid with output signal (green line) after correction for the delay in acquisition. During calibration the system is designed to intentionally overshoot the bounds of the DAW junction. Since the starting and ending points for calibration are not critical, this makes it easier to set up as described in the text. The ideal response would be a closely tracking output signal transitioning to plateaus after the system moves beyond 0% and 100% mixing ratios. As can be seen in the figure, this is what we observe, except for a slight rounding near the plateau region. (B) Compression of the data in part A into a single curve by mapping the input pressure directly to the output mixing ratio. Blue curve is the compressed data, while the green dots are the expected results from Comsol modeling. As can be seen in the figure, the modeling and experimental results are in excellent agreement. (C) Completed calibration for both inputs. Red crosses and pink diamonds represent polynomial fits of inputs 1 and 2, respectively, to the output mixing ratio. These fits can be used to program a linear actuator controller to generate precise inducer waves. (D) Measure of the percent error of the uncalibrated output signal, which general is less than 3%.