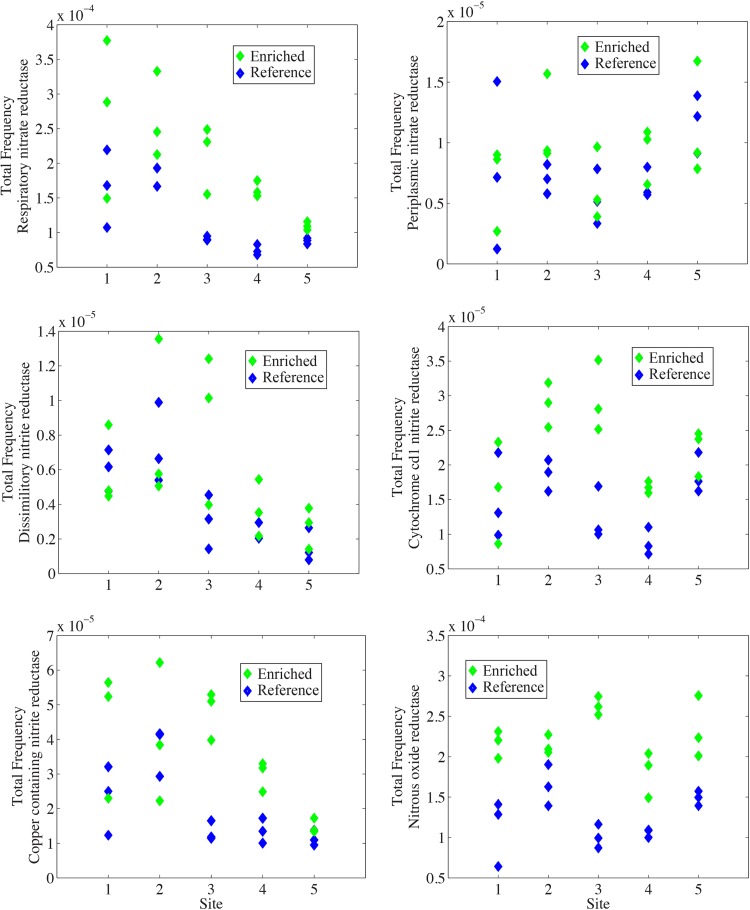
FIG 3.
Plots showing the frequency of annotations corresponding to enzymes associated with various steps in the denitrification pathway. Each panel represents the abundance of annotations corresponding to a given enzyme across all 5 sites in both the enriched and reference creeks. Multiple points at each site represent replicate samples.

