FIG 4.

Species richness was correlated with oxalate consumption (repeated-measures Pearson correlation with a P of 0.001 and an r of 0.529). The symbols represent mean oxalate consumption and species richness for each treatment.

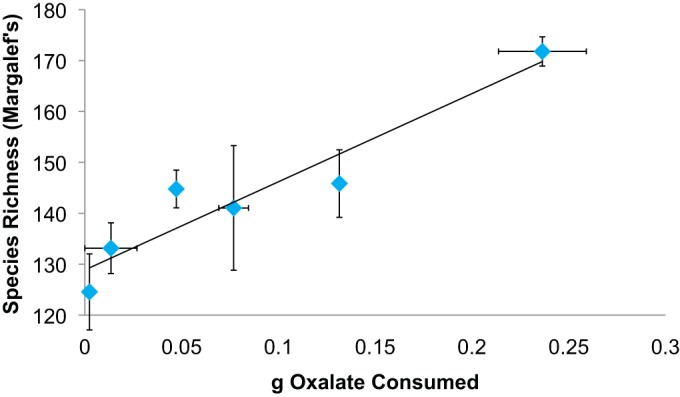
Species richness was correlated with oxalate consumption (repeated-measures Pearson correlation with a P of 0.001 and an r of 0.529). The symbols represent mean oxalate consumption and species richness for each treatment.