FIG 4.
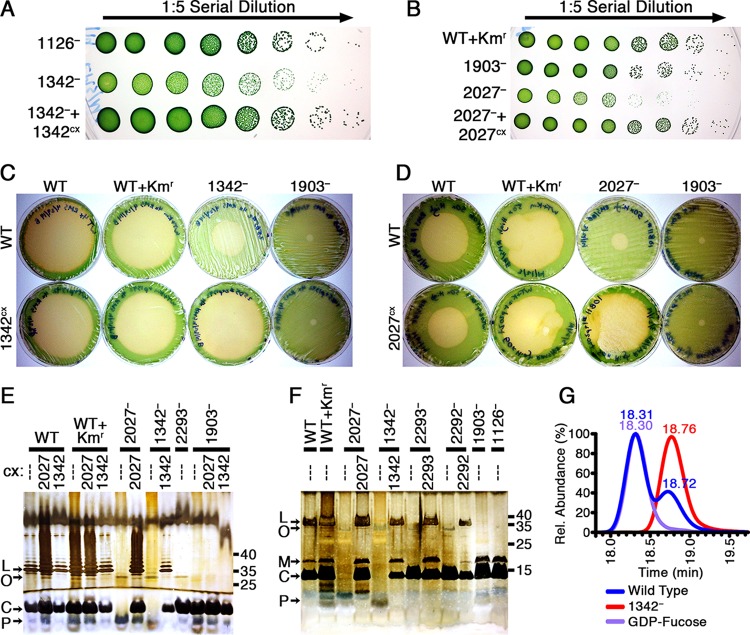
Analysis of mutants in the 1342 and 2027 loci. (A and B) Serial dilution (1:5) spot plates of 8-day-old cultures of 1342− (A) and 2027− (B) strains, with increasing dilutions plated from left to right so that individual colonies are visible on the right. Plates were photographed after 7 days of growth. (C and D) Photographs of plaque plates taken 6 days following addition of amoebae to investigate the grazer resistance of 1342− (C), 2027− (D), and related expression strains compared to the WT, WT+Kmr, and 1903− controls. Plates in panel C were generated using 4× cell concentrates, whereas plates in panel D were made with 50× cell concentrates, as described in Materials and Methods. The strain on each plate is identified by a combination of column and row labels as in Fig. 1. (E and F) Outer membrane preparations were analyzed by silver staining Tris-glycine (E) and Tris-Tricine (F) SDS gels, labeled as in Fig. 3. The sample loaded in each lane is identified by a combination of the parental strain on top and the constitutive expression construct below it. (G) LC-MS chromatograms for samples of the WT and 1342− of HPLC fractions eluted at the same time as a GDP-fucose standard.

