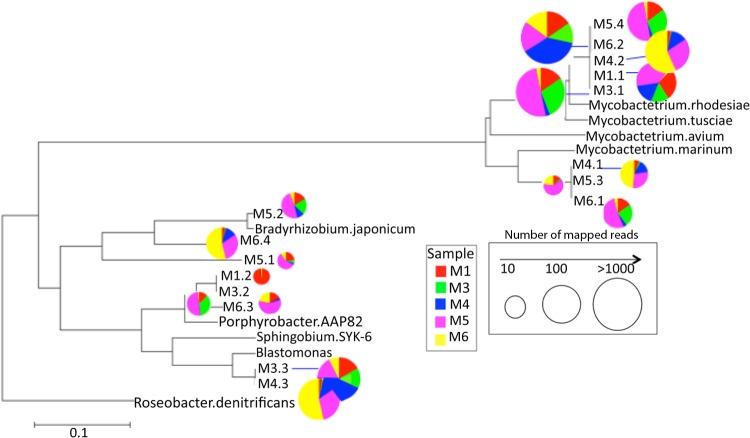
FIG 2.
Phylogenetic relationships and relative abundance of the populations recovered in the shower hose metagenomes. The tree shows all 30S ribosomal protein S9 sequences assembled from the metagenomes and selected reference sequences from publicly available genomes (denoted by complete species names). The radius of the pie charts indicates the number of reads mapping to the specific protein sequence related to the node, and the colors represent the five different data sets (see figure key). Roseobacter denitrificans was used as an outgroup. The phylogenetic tree was constructed using the neighbor-joining algorithm with 1,000 bootstrap replicates in MEGA5 (91). The scale bar represents the number of substitutions per site.

