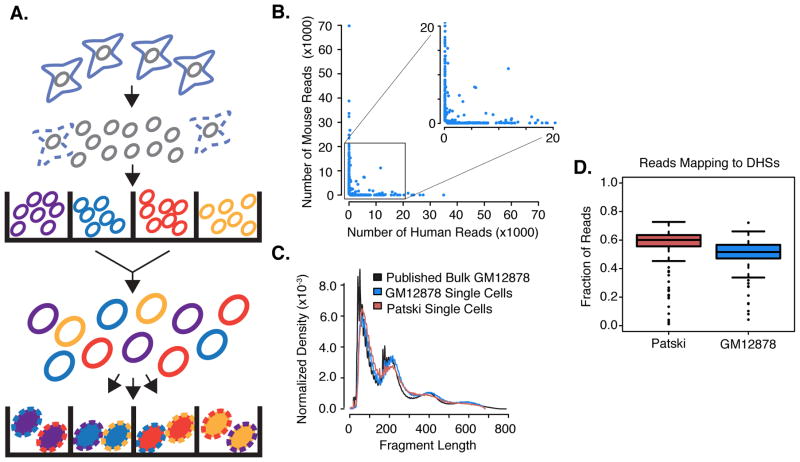
Fig. 1. Schematic of combinatorial cellular indexing and validation for measuring single-cell chromatin accessibility.
(A) Nuclei are isolated and molecularly tagged in bulk with barcoded Tn5 transposases in wells (labels A–D). Nuclei are then pooled and a limited number redistributed into a second set of wells. A second barcode (labels 1–4) is introduced during PCR. (B) Scatterplot of number of reads mapping uniquely to human or mouse genome for individual barcode combinations. (C) Fragment size distribution for single-cell ATAC-seq vs. published bulk ATAC-seq (4). (D) Boxplot of the fraction of reads mapping to ENCODE-defined DHSs for individual Patski and GM12878 cells.

