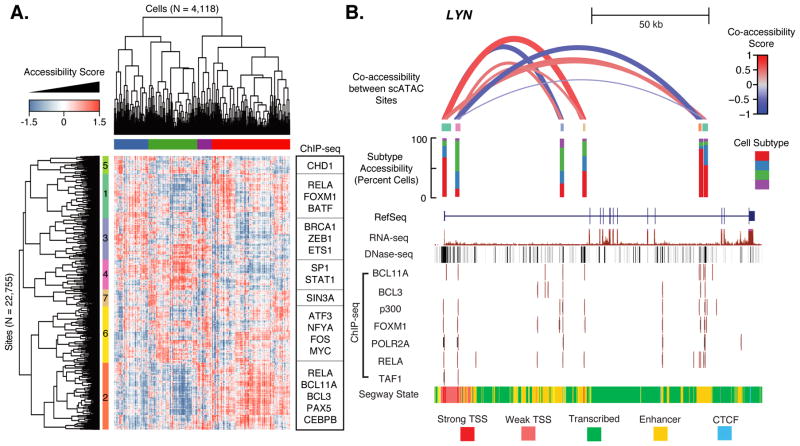
Fig. 4. Single-cell ATAC-seq identifies GM12878 subtypes.
(A) Heatmap of chromatin accessibility measures after latent semantic indexing of DHS usage shows GM12878 cells cluster into subpopulations. Modules of coordinately accessible chromatin accessibility are significantly enriched for binding of selected transcription factors (TFs) (examples on right). (B) Detailed depiction of LYN locus. Top shows “co-accessibility scores” between the transcription start sites and four putative enhancers in the region, which are Pearson correlation values of LSI accessibility scores between cells, for six DHSs present in this region. Height and thickness of each loop indicates the strength of correlation (red=positive; blue=negative). Middle shows in which subtypes (defined in top bar of (A)) these elements are most often accessible. Bottom shows ENCODE data for this region from UCSC browser, including transcript model, DHS peaks, ChIP-seq binding profiles for several TFs, and predicted chromatin state.

