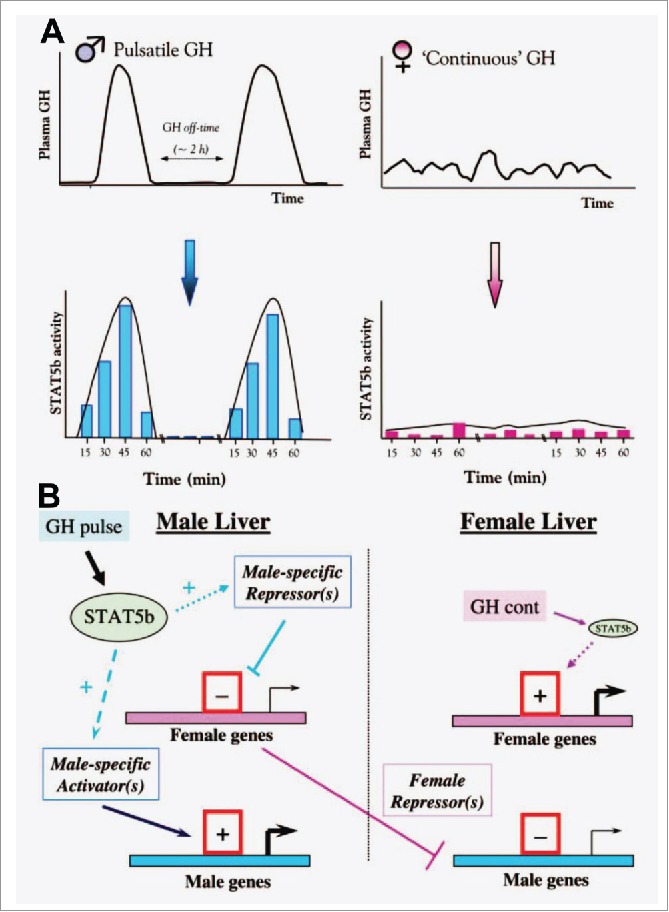
FIGURE 3.

Schematics illustrating concepts of how male (pulsatile) vs female (more continuous) patterns of circulating GH elicit patterned activation of PY-STAT5 in the rat liver (Panel A), and thus sex-biased gene expression (Panel B). Schematics adapted from Waxman and O'Connor (2006) with permission of The Endocrine Society.67
