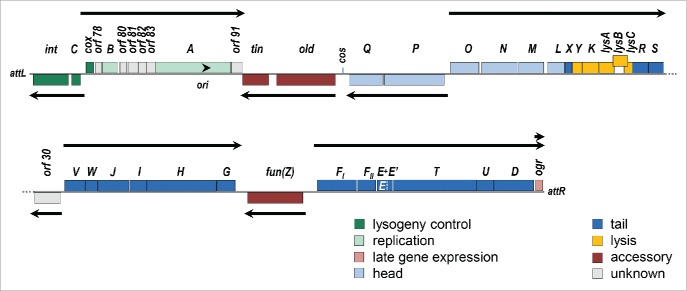
Figure 2.
P2 genetic map. The P2 genome is displayed in prophage orientation, beginning at the leftward attachment site (attL). Genes are color coded by function, as indicated, and genes above the line are read rightwards while those below the line are read leftwards. Arrows indicate the direction and extent of each transcription unit. The arrowhead indicates the location of the replication origin (ori) and direction of replication. The lysB gene is offset to illustrate the overlap with lysC; the dotted white line indicates the end of gene E within the longer E+E’ coding sequence generated by a-1 frameshift.

