
Figure 6.
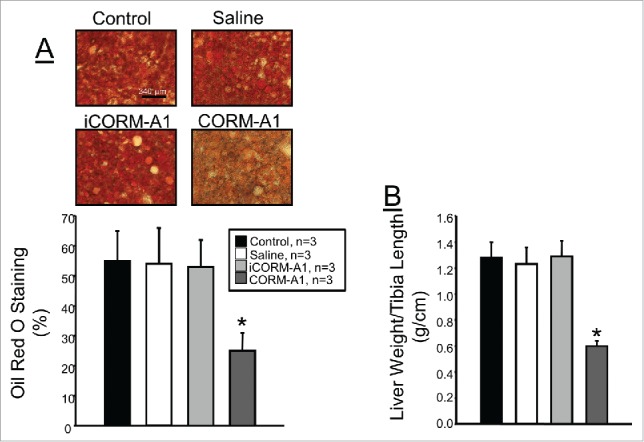
(A) Representative images and quantification of hepatic steatosis as measured by Oil Red O staining of liver sections. (B) Liver to tibia length ratios in each group obtained at the end of the 30 week study. * = P < 0.05 as compared to other groups.