
Figure 3.
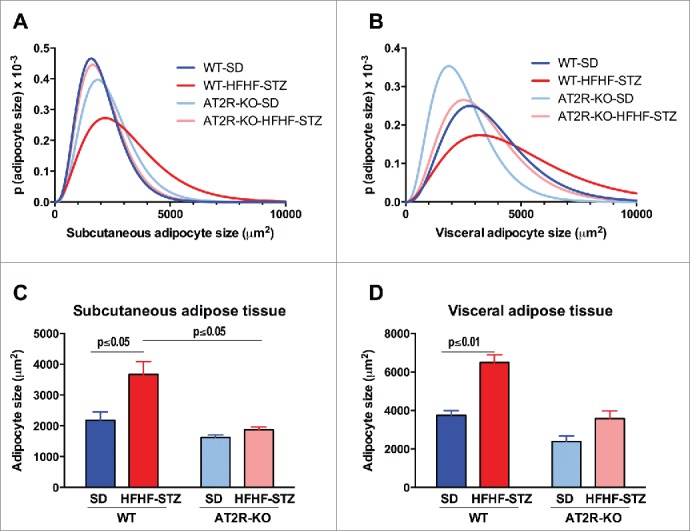
Effect of HFHF-STZ on adipocyte size distribution in WT and AT2R-KO mice. Mice were fed a standard diet (SD) or high-fat/high-fructose diet with STZ (HFHF-STZ) for 6 weeks. Adipocyte size distribution (A, B) and areas (C, D) from subcutaneous adipose tissue (A, C) and visceral (retroperitoneal) (B, D) adipose tissue. Data are presented as mean ± SE (n = 8–10). Statistical analyses were performed using one-way ANOVA followed by the Tukey's multiple comparisons test. (A, C), Statistical significance.