Figure 2.
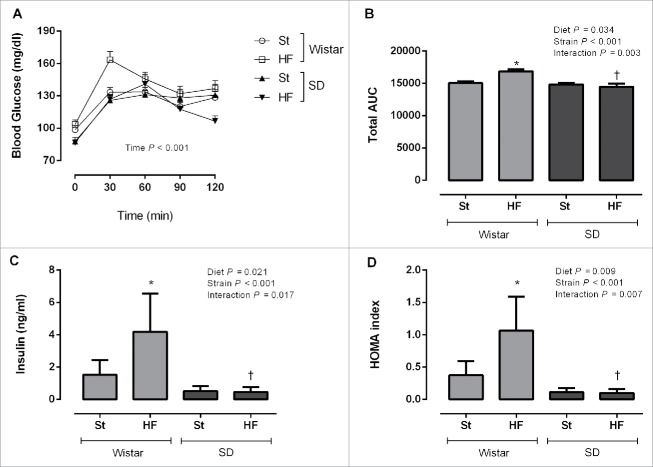
Glycaemic response during oral glucose tolerance test (A), total area under the curve (AUC) (B), fasting insulin plasma levels (C) and homeostasis model assessment (HOMA) (D) of Wistar and Sprague-Dawley (SD) rats after 9 weeks of feeding either with standard (St) or high-fat (HF) diet. HOMA was calculated using the formula: fasting glucose (mg/dl) × fasting insulin (ng/ml)/405. Data are presented as mean ± SEM (n = 5–6 rats per group). *P < 0.05 vs respective St diet group and †P < 0.05 between HF diet groups.

