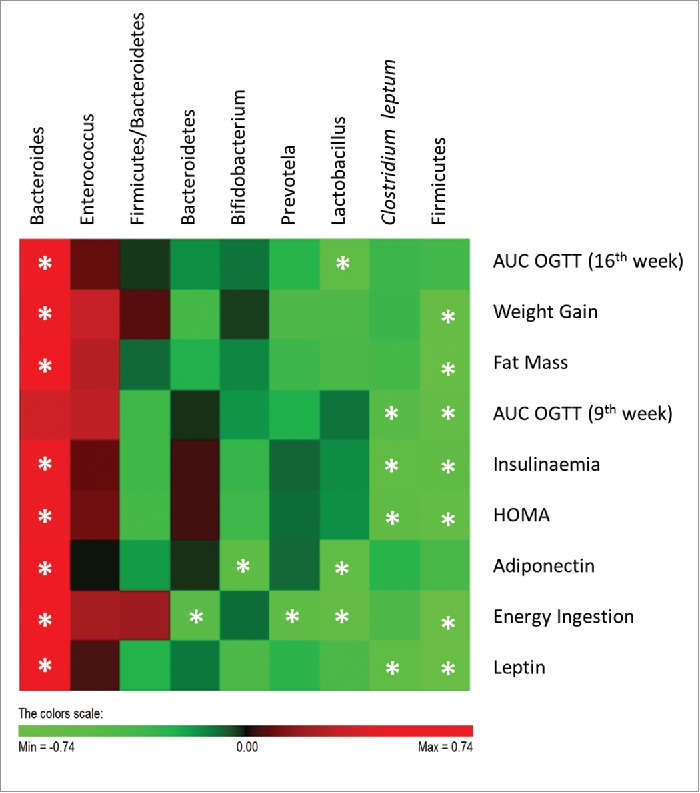
Figure 7.

Correlations between gut microbiota and host metabolic parameters. Data of all experimental groups were gathered and analyzed by SPSS software (20.0 version) using 2-tailed Pearson's correlation test. The scores of Pearson's correlation were figured by PermutMatrix software (Version 1.9.3 EN) using heatmap plots. As shown by the colors scale, green color indicates a negative correlation while red color indicates a positive correlation. The symbol (*) indicates a statistical significant correlation (P < 0.05).
