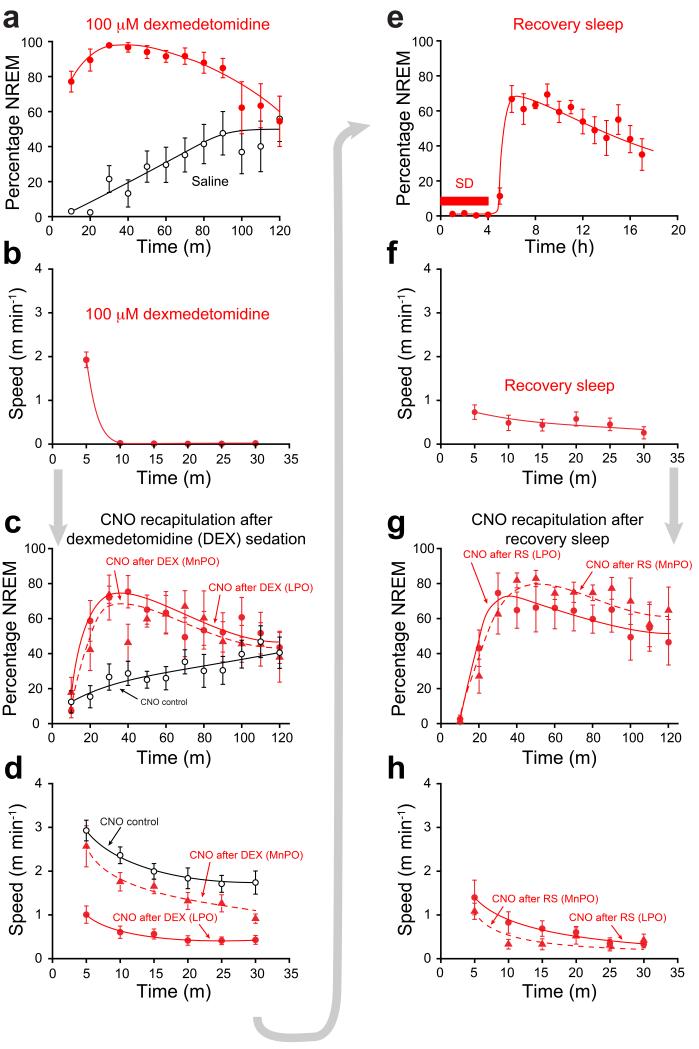
Figure 4.
Serial re-activation of genetically tagged neuronal ensembles following dexmedetomidine-induced sedation and recovery sleep. (a) Percentage NREM sleep after dexmedetomidine. Both LPO-TetTag-hM3Dq (n=6) and MnPO-TetTag-hM3Dq (n=6) mice showed sustained NREM, significantly greater than control (P<0.0001). Data shown are for LPO-TetTag-hM3Dq mice. (b) Speed in an open field 30 min after dexmedetomidine. Data shown are for LPO-TetTag-hM3Dq mice (n=7). (c) NREM sleep after CNO injection, four days after dexmedetomidine sedation. Filled circles: LPO-TetTag-hM3Dq mice (n=7; P<0.0001, compared to control) after CNO injection. Filled triangles: MnPO-TetTag-hM3Dq (n=6; P<0.001, compared to control) mice after CNO injection. Open circles: LPO-TetTag-hM3Dq (n=9) mice after control CNO injection without prior sedation or recovery sleep. (d) Speed in an open field 30 min after CNO injection, four days after dexmedetomidine sedation. Filled circles: after CNO injection for LPO-TetTag-hM3Dq mice. Filled triangles: after CNO injection for MnPO-TetTag-hM3Dq mice. Open circles: after control CNO injection without prior sedation or recovery sleep. CNO recapitulated the effects of dexmedetomidine in LPO-TetTag-hM3Dq (n=8; P<0.0001) but not in MnPO-TetTag-hM3Dq mice (n=6; P=0.1) compared to control (n=7). (e) NREM after 4 hours sleep deprivation (SD) (n=6). (f) Speed in an open field 30 min during recovery sleep (n=8). (g) NREM sleep after CNO injection, four days after sleep deprivation/recovery sleep. Filled circles: LPO-TetTag-hM3Dq mice (n=8; P<0.0001, compared to baseline) after CNO injection. Filled triangles: MnPO-TetTag-hM3Dq (n=7; P<0.0001, two-way ANOVA compared to baseline) mice after CNO injection. (h) Speed in open field 30 min after CNO injection, four days after recovery sleep. CNO recapitulated the effects of recovery sleep in both LPO-TetTag-hM3Dq (n=8; P<0.0001) and in MnPO-TetTag-hM3Dq mice (n=7; P<0.0001, two-way ANOVA) compared to baseline (n=7). For all panels the error bars represent s.e.m and the statistical tests were two-way ANOVA.

